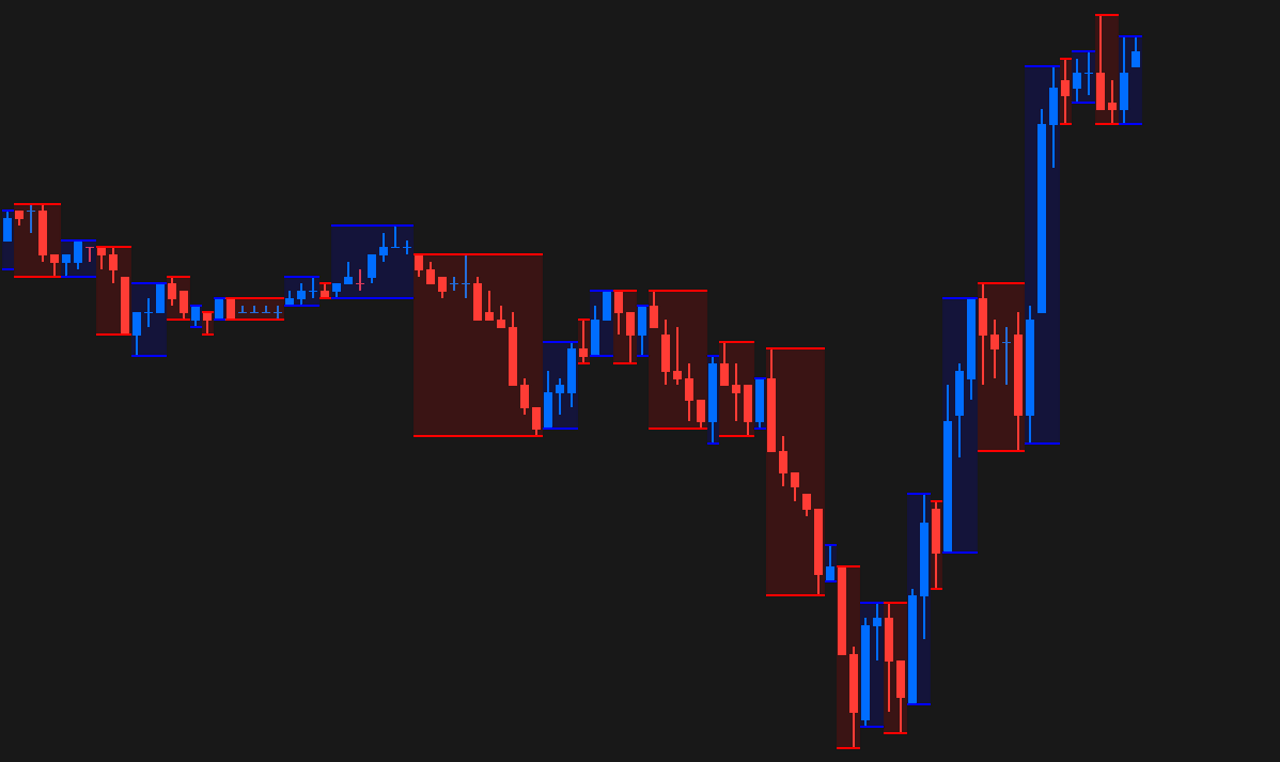
The Swing Box Study draws highlight boxes around the chart bars that constitute each minor price rotation. Additionally, the study can also be configured to show any or all of: Swing Point of Control; Swing Value Area; and Swing VWAP.
Note:
- This study can only be used on charts with a chart data type of ‘Intraday Chart‘
- It is recommended to use ‘Intraday Data Storage Time Unit‘ setting ‘1 Tick’
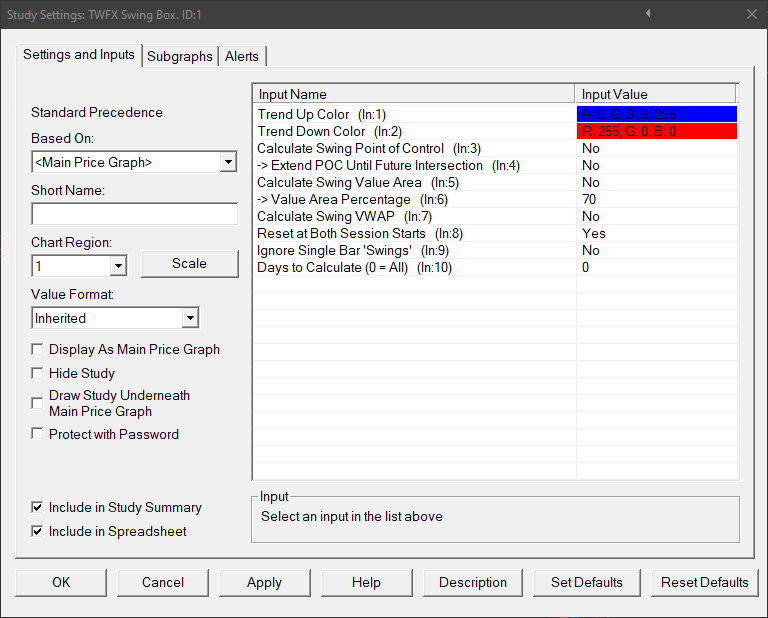
Inputs
Trend Up Color (In:1)
Defines the color used for the highlight boxes when price movement is positive.
Trend Down Color (In:2)
Defines the color used for the highlight boxes when price movement is negative.
Calculate Swing Point of Control (In:3)
When enabled, the ‘Swing Point of Control’ will be calculated and displayed for each ‘Swing Box’.
For the purposes of this study, Swing Point of Control is defined as the price within the swing having the greatest total traded volume.
Extend POC Until Future Intersection (In:4)
When enabled, the ‘Swing Point of Control’ line will be projected across the chart into the future, until intersected by another chart bar.
Calculate Swing Value Area (In:5)
For the purposes of this study, Swing Value Area is defined as the range of prices within the swing containing the defined percentage (default: 70%) of total traded volume.
Defines the volume percentage taken to constitute the value area.
- Min: 50%
- Max: 100%
Calculate Swing VWAP (In:7)
For the purposes of this study, Swing VWAP is simply the Volume Weighted Average Price, calculated at each chart bar within the swing and including all prior bars within the swing.
Reset at Both Session Starts (In:8)
Swing box calculations reset at the beginning of each trading day, when this setting is enabled, they also reset at the beginning of the day session, as defined by the charts session times settings.
Ignore Single Bar ‘Swings’ (In:9)
If a swing consists of only a single chart bar, then when this setting is enabled, no highlight box will be drawn, nor will any values be calculated for the single bar.
Days to Calculate (In:10)
Defines the number of days over which the study is calculated, can be used to reduce the initial study calculation time when many days worth of data is loaded into the chart but this study is only required to be shown on the most recent days.
- Min: 0 (in which case all loaded bars are evaluated during the study calculation)
- Max: 1000000
Subgraphs
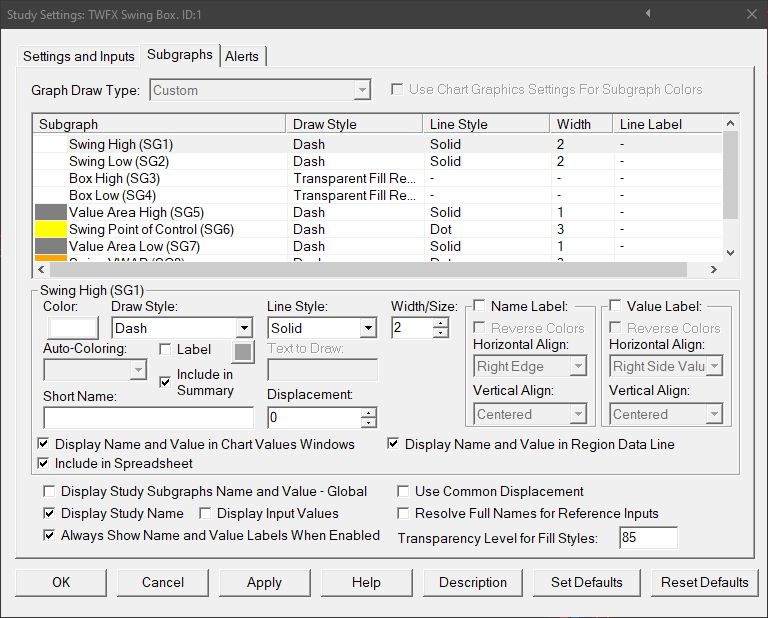
Swing High (SG1)
Default: Dash
Displays a line at the high of each swing box, independently of the highlight box.
Swing Low (SG2)
Default: Dash
Displays a line at the low of each swing box, independently of the highlight box.
Box High (SG3)
Default: Transparent Fill Rectangle Top
Box Low (SG4)
Default: Transparent Fill Rectangle Bottom
Box High and Box Low subgraphs are used together to draw the swing highlight boxes, for more detailed information refer to the following link: Top and Bottoms Drawstyles
Value Area High (SG5)
Default: Dash
Displays a line at the value area high (when enabled) for each swing box.
Swing Point of Control (SG6)
Default: Dash
Displays a line at the swing point of control (when enabled) for each swing box.
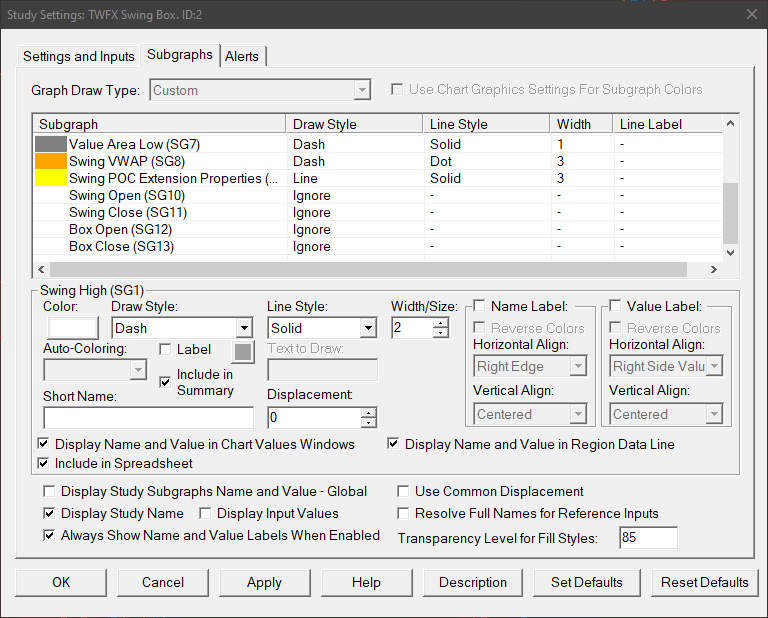
Value Area Low (SG7)
Default: Dash
Displays a line at the value area low (when enabled) for each swing box.
Swing VWAP (SG8)
Default: Dash
Display a line at the VWAP (when enabled) for each chart bar within each swing box.
Swing POC Extension Properties (SG9)
Default: Line
Defines the POC extension line properties: Line Style; Line Width; and Color.
Swing Open (SG10)
Default: Ignore
Stores the opening prices, can be used to display the open price of each swing box.
Swing Close (SG11)
Default: Ignore
Stores the closing prices, can be used to display the close price of each swing box.
Box Open (SG12)
Default: Ignore
Stores the opening prices.
Box Close (SG13)
Default: Ignore
Stores the closing prices.
Box Open and Box Close can be used together, similarly to Box High and Box Low, to draw a swing highlight box from the opening price to the closing price.