The Swing Volume Study tracks and displays total traded volume for each minor price rotation, the data can be displayed either: As a box representing total volume per swing; or as a histogram displaying accumulated volume per chart bar.
Note:
- This study can only be used on charts with a chart data type of ‘Intraday Chart‘
- It is recommended to use ‘Intraday Data Storage Time Unit‘ setting ‘1 Tick’
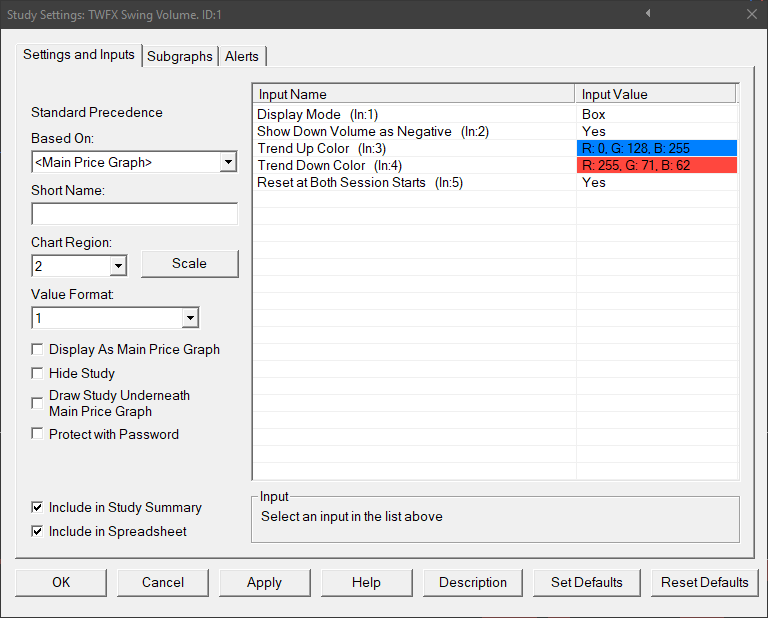
Inputs
Defines the mode used to display accumulated volume.
- Box: Accumulated swing volume is represented by a box, spanning from start to end of the swing, the height of which being the total volume accumulated during the swing.
- Histogram: Accumulated swing volume is displayed in histogram format showing the accumulated volume at each individual chart bar.
Show Down Volume as Negative (In:2)
When enabled, volume accumulated as price is moving down is represented by a negative number.
Trend Up Color (In:3)
Defines the color used for swing volume subgraph output when price movement is positive.
Trend Down Color (In:4)
Defines the color used for swing volume subgraph output when price movement is negative.
Swing volume calculations reset at the beginning of each trading day, when this setting is enabled, they also reset at the beginning of the day session, as defined by the charts session times settings.

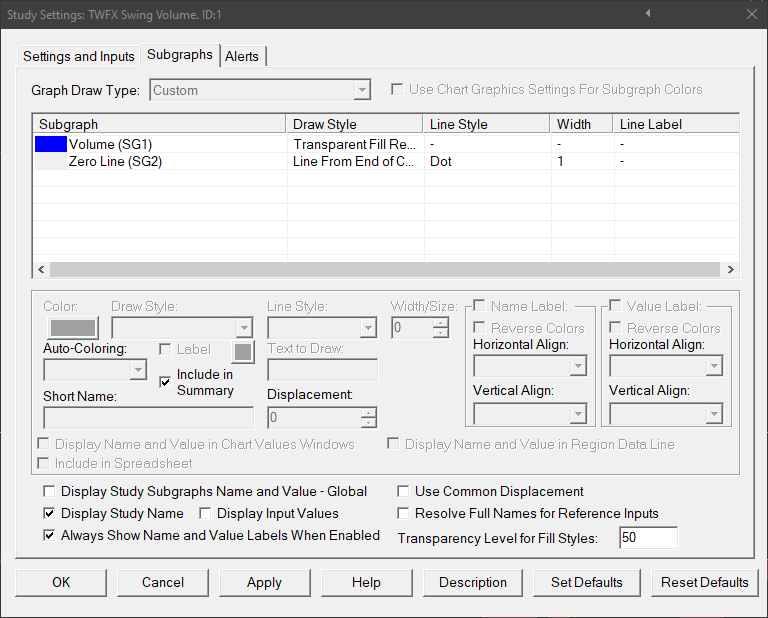
Subgraphs
Volume (SG1)
Default: Transparent Fill Rectangle to Zero
Displays the accumulated swing volume, the color being determined by the study, based on the ‘Trend Up Color’ and ‘Trend Down Color’ settings.
Default: Line from End of Chart Left to Right
Displays a line at the zero axis, when ‘Show Down Volume as Negative’ is enabled.