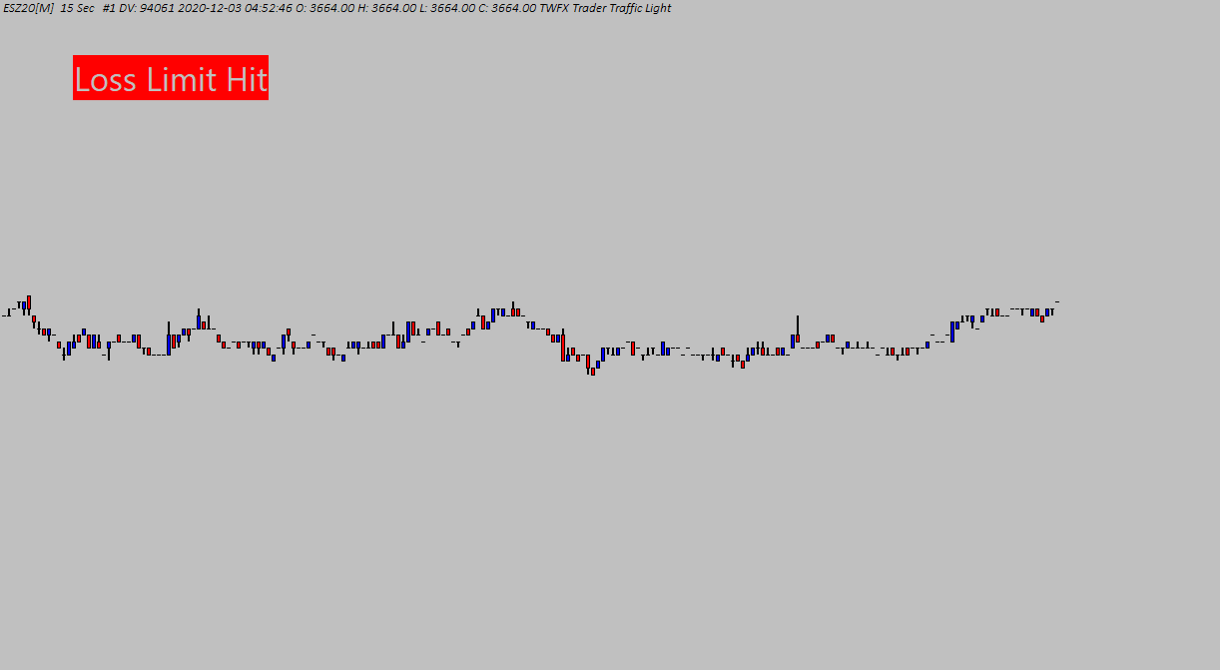
The Trader Traffic Light study monitors net profit and loss (both open and closed) for the current trading day and then compares against configurable thresholds/targets, a marker (or text) is then displayed on the chart, colored according to the current profit/loss state vs. the target values.
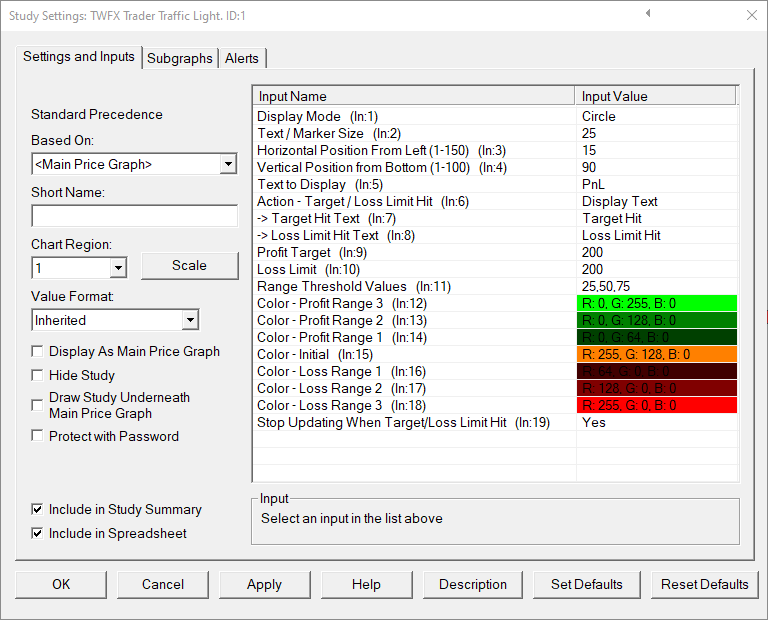
Inputs
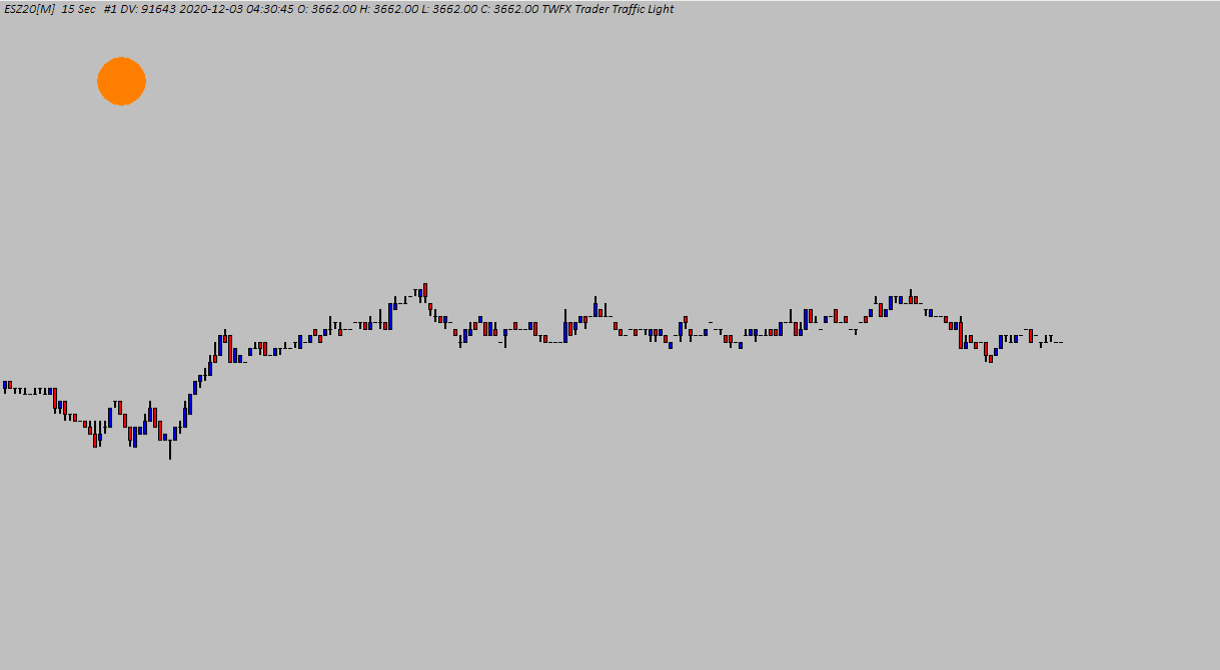
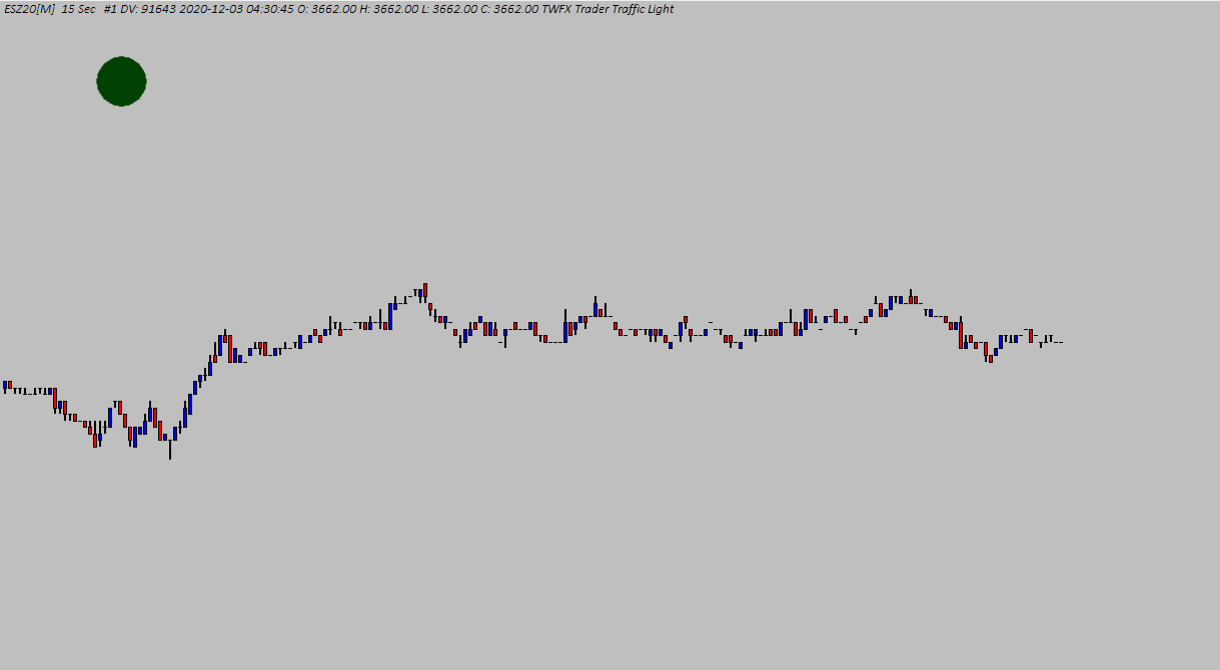
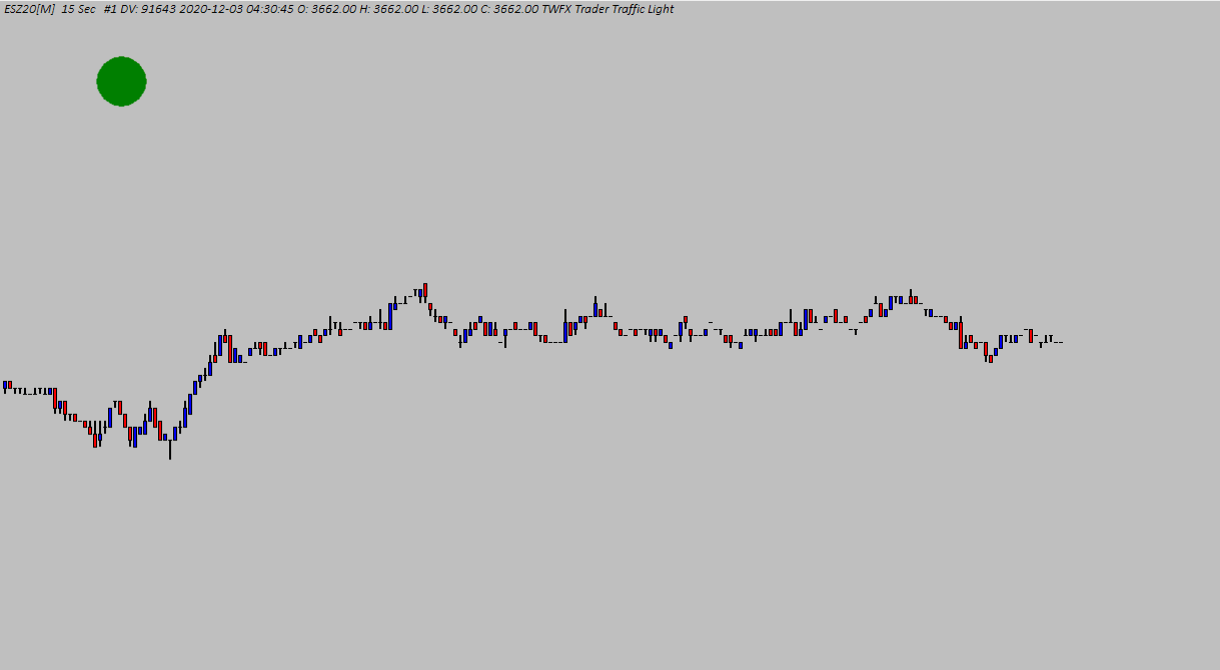
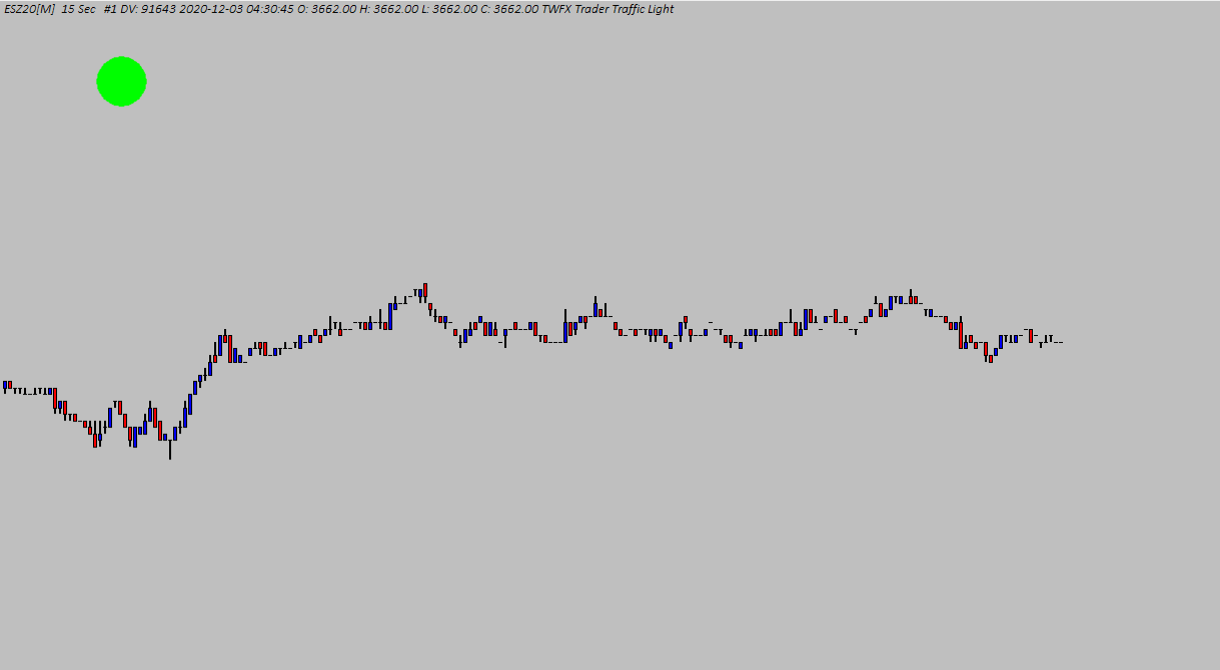
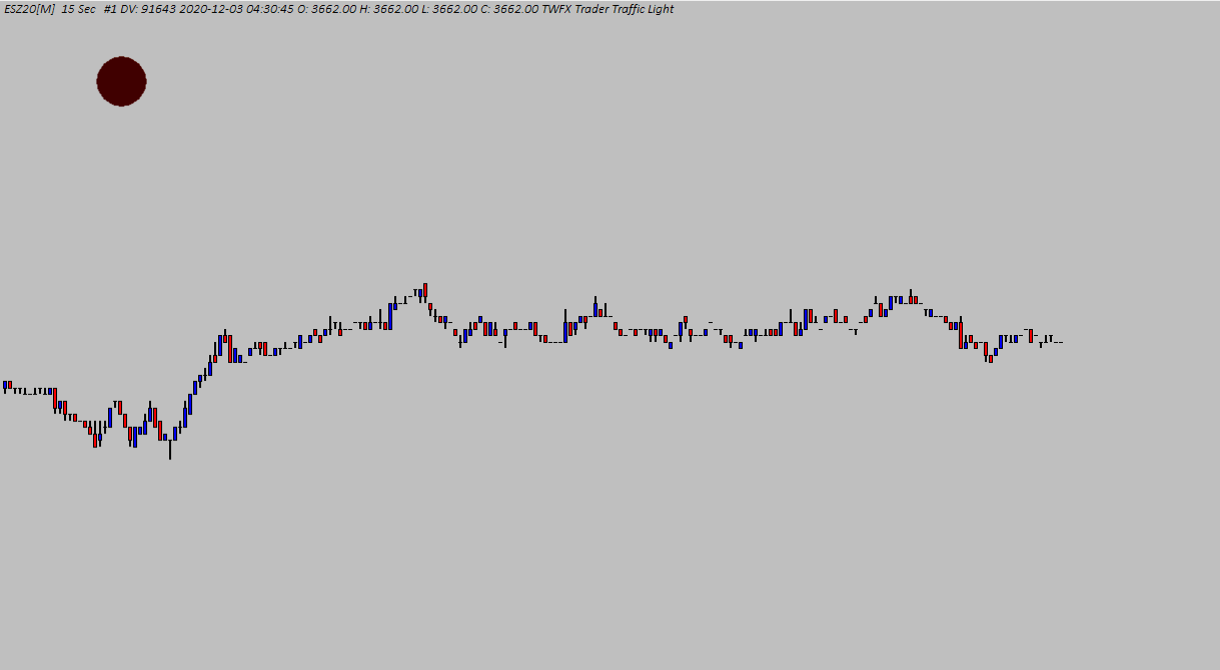
Display Mode (In:1)
Defines how the current profit / loss situtaion is displayed on the chart.
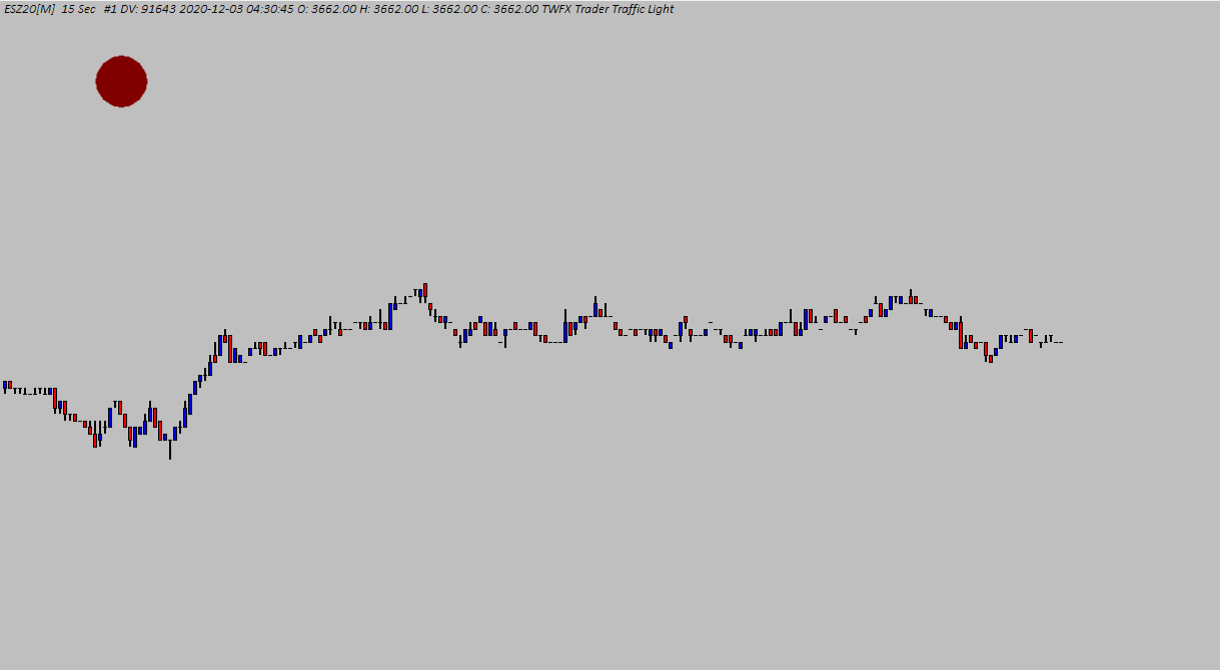
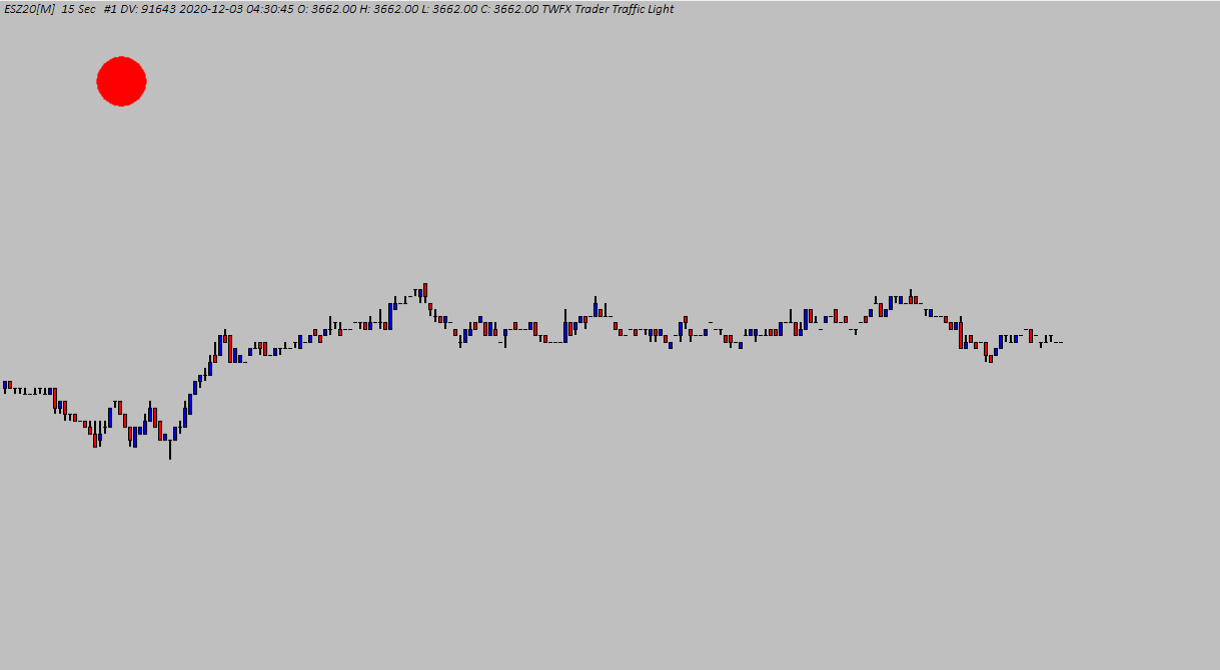
- Circle:
A circular marker of specified size is drawn at the defined location. - Square:
A square marker of specified size is drawn at the defined location. - Text:
Text defined by the ‘Text to Display’ setting and of the specified size is drawn at the defined location. - Actual:
The actual profit / loss value is displayed as text of the specified size, and at the defined location.
Text / Marker Size (In:2)
Defines the size used to draw the traffic light marker or text.
- Min: 5
- Max: 100
Horizontal Position from Left (1-150) (In:3)
Defines the horizontal position of the traffic light marker / text, measured from the left hand side of the chart.
- Min: 1
- Max: 150
Vertical Position from Bottom (1-100) (In:4)
Defines the vertical position of the traffic light marker / text, measured from the bottom of the chart.
- Min: 1
- Max: 100
Text to Display (In:5)
Defines the text to be displayed on the chart when using ‘Text’ display mode.
Action – Target / Loss Limit Hit (In:6)
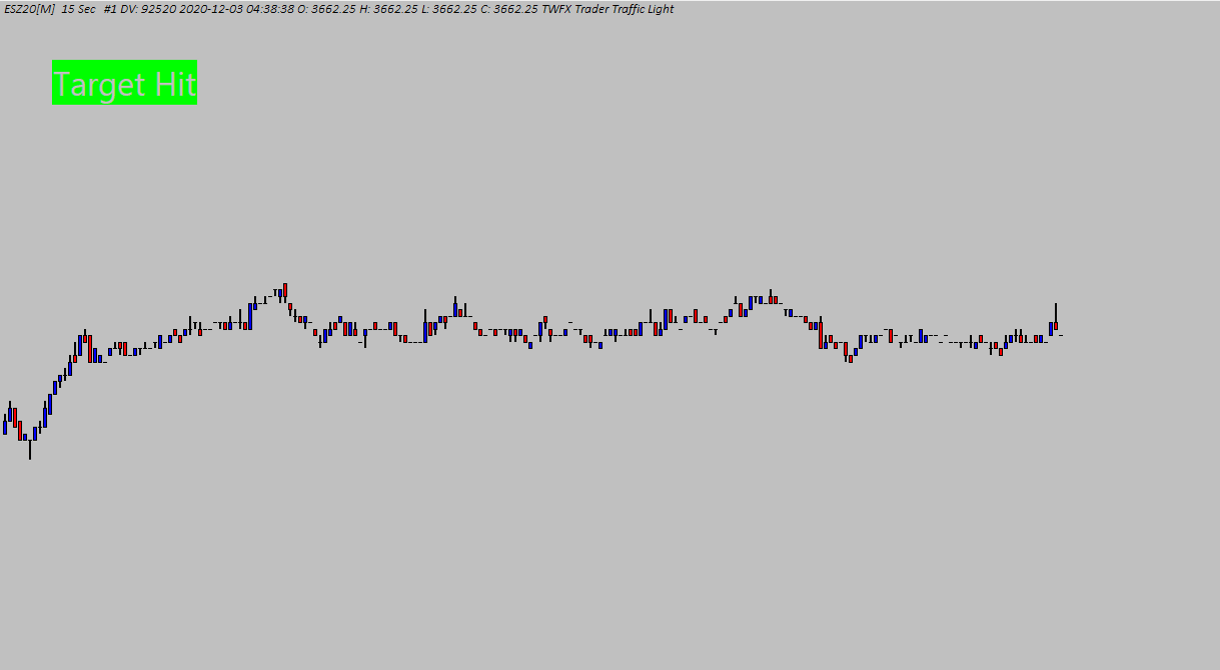
Defines the marker / text beahvior when either the profit target or loss limit is hit.
- Display Text:
Display the text defined by either ‘Target Hit Text’ or ‘Loss Limit Hit Text’ - Increase Marker Size / Reverse Text Colors:
When using ‘Circle’ or ‘Square’ display mode, the marker size is doubled so that it becomes more prominent.
When using ‘Text’ or ‘Actual’ display mode, the text coloring is reversed i.e. the text is drawn in the chart background color and highlighted using the relevant profit / loss color.
Target Hit Text (In:7)
Defines the text to be display on the chart when using ‘Display Text’ option and the profit target is met (or exceeded).
Loss Limit Hit Text (In:8)
Defines the text to be display on the chart when using ‘Display Text’ option and the loss limit is met (or exceeded).
Profit Target (In:9)
Defines the daliy profit target (using the Common Profit / Loss Currency).
- Min: 1
- Max: 1000000
Loss Limit (In:10)
Defines the daliy loss limit (using the Common Profit / Loss Currency).
- Min: 1
- Max: 1000000
Range Threshold Values (In:11)
Defines the percentage thresholds (of which there are three) at which the color of the traffic light display changes.
NOTE: Must be bewteen 0 and 100, entered in ascending order and separated by commas e.g. 25,50,75 for 25%, 50% and 75% threshold values.
Color – Profit Range 3 (In:12)
Defines the color used when the current net profit exceeds the third threshold value.
Color – Profit Range 2 (In:13)
Defines the color used when the current net profit exceeds the second threshold value.
Color – Profit Range 1 (In:14)
Defines the color used when the current net profit exceeds the first threshold value.
Color – Initial (In:15)
Defines the color used when the current net profit/loss is less than the first profit threshold, but is greater than the first loss threshold.
Color – Loss Range 1 (In:16)
Defines the color used when the current net loss exceeds the first threshold value.
Color – Loss Range 2 (In:17)
Defines the color used when the current net loss exceeds the second threshold value.
Color – Loss Range 3 (In:18)
Defines the color used when the current net loss exceeds the third threshold value.
Stop Updating When Target / Loss Limit Hit (In:19)
When enabled, and either target or limit is hit, no further changes will be made to the maker / text coloring.