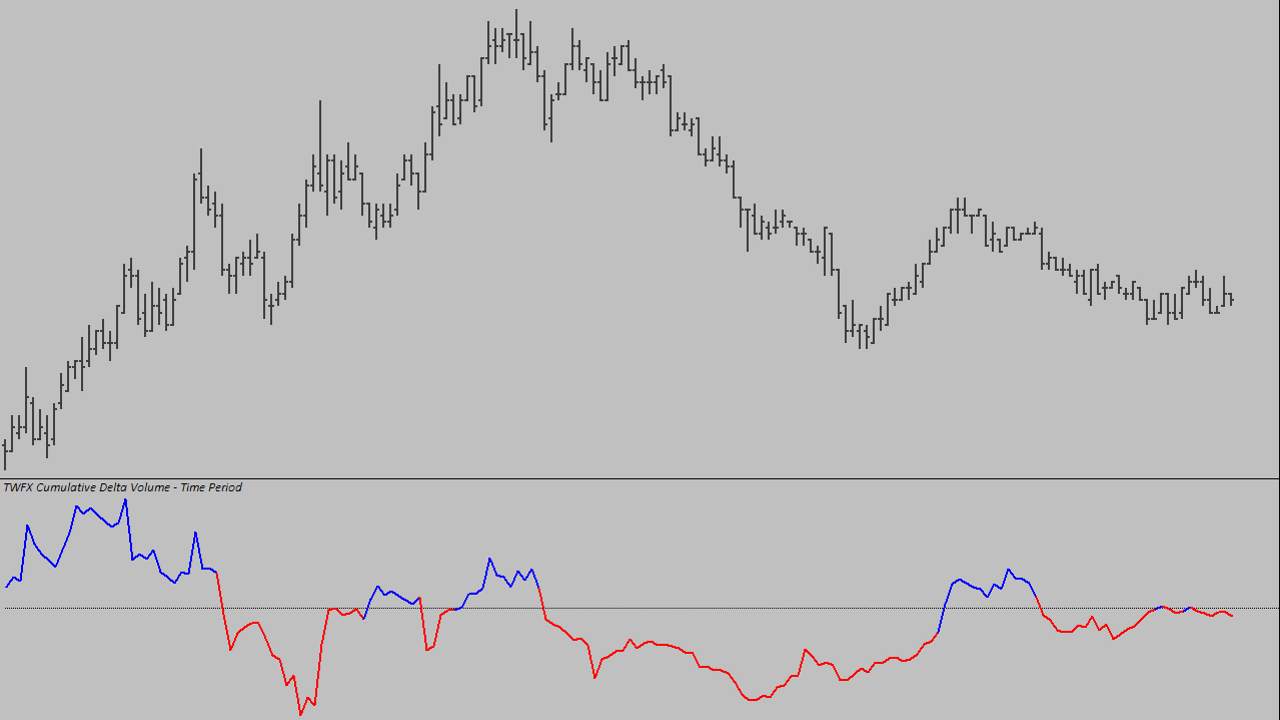
The Cumulative Delta Volume – Time Period study tracks and accumulates the difference (Delta) between the Ask and Bid volume traded per chart bar period.
The accumulated sum can be reset each day or session start, additionally, the accumulation period can be either continuous, cover a fixed repeating time period, or a fixed rolling time period.
The study is summarised in the following update post – Cumulative Delta – Time Period.
Note:
- This study can only be used on charts with a chart data type of ‘Intraday Chart‘
- It is recommended to use ‘Intraday Data Storage Time Unit‘ setting ‘1 Tick’
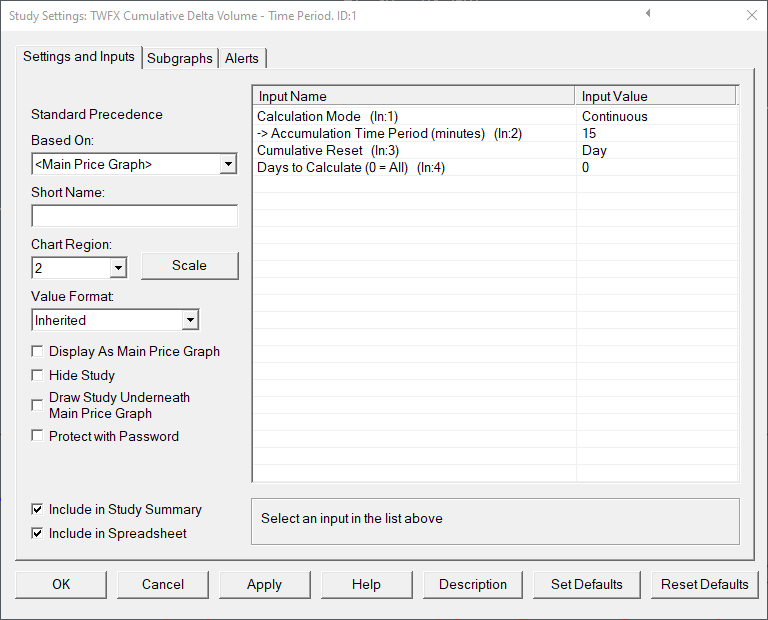
Inputs
Defines the cumulative delta sum calculation mode.
- Continuous:
Delta sum is a continuous accumulation and resets according to ‘Cumulative Reset’ setting. - Time Period – Rolling:
Delta sum is a continuous rolling accumulation based on the ‘Accumulation Time Period (minutes)’ setting and resets according to ‘Cumulative Reset’ setting. - Time Period – Fixed:
Delta sum is a calculated for fixed, repeating accumulation periods based on the ‘Accumulation Time Period (minutes)’ setting and also resets according to ‘Cumulative Reset’ setting.
Accumulation Time Period (minutes) (In:2)
Defines the time period used when performing a ‘Time Period – Rolling’ or ‘Time Period – Fixed’ cumulative delta sum calculation.
- Min: 1
- Max: 1440
Defines the cumulative reset mode.
- None:
The cumulative delta accumulation sum is never reset, and as such is based on all of the loaded chart bars. - Day:
The cumulative delta accumulation sum is reset at the beginning of each trading day, according to the chart session times. - Session:
The cumulative delta accumulation sum is reset at the beginning of each trading session, according to the chart session times.
Days to Calculate (In:4)
Defines the number of days over which to perform the study calculations.
- Min: 0 (calculate for all days loaded in chart)
- Max: 1000000
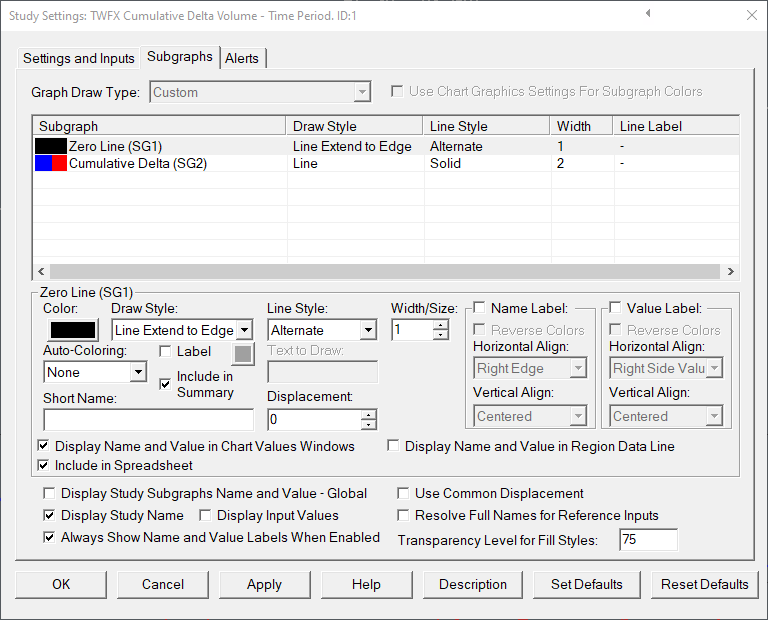
Subgraphs
Default: Line Extend to Edge
Displays horizontal axis at zero to suit zero centered subgraph display
Cumulative Delta (SG2)
Default: Line
Displays cumulative sum of delta, the difference bewteen the Ask and Bid traded volume