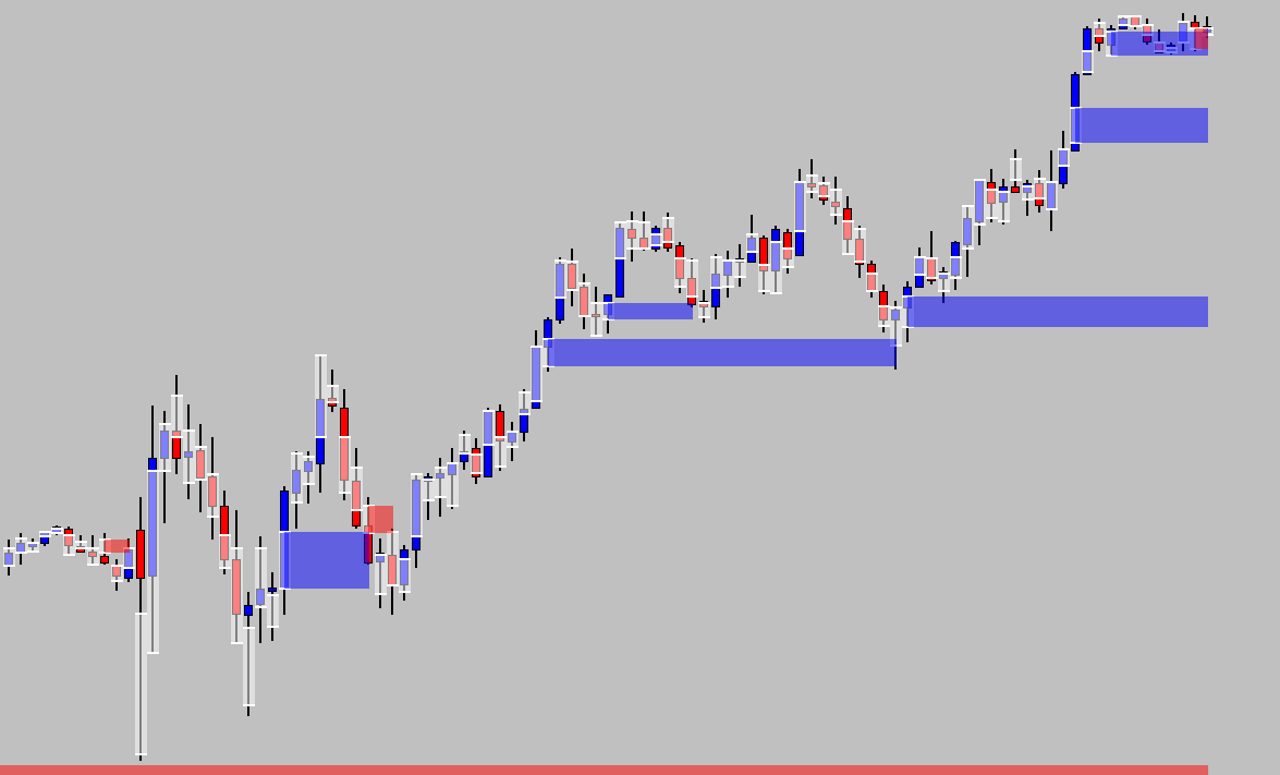
The Value Area of Bars Study highlights the value area for each chart bar, based on the user defined value area percentage. Optionally the value area can be extended into the future until intersected by price and/or colored according to bar direction.
Note:
- This study can only be used on charts with a chart data type of ‘Intraday Chart‘
- It is recommended to use ‘Intraday Data Storage Time Unit‘ setting ‘1 Tick’
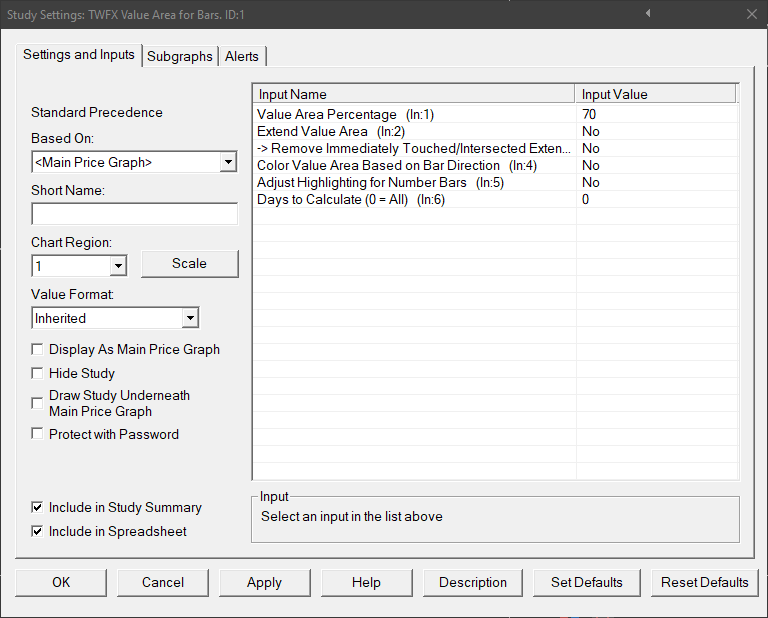
Inputs
Value Area Percentage (In:1)
Defines the volume percentage taken to constitute the value area.
- Min: 50%
- Max: 100%
Extend Value Area (In:2)
When enabled, the value area highlighting is extended into the future, until intersected by price. The appearance of this highlighting is controlled via the ‘Value Area Extension Properties Subgraph’.
Remove Immediately Touched/Intersected Extensions (In:3)
Value area extension highlighting is removed for a chart bar if the value is touched or intersected by the next chart bar.
Color Value Area Based on Bar Direction (In:4)
Bar value area highlighting is colored based on the current bar direction and using the colors set via the ‘Value Area Extension Properties Subgraph’, up bar value areas being colored using the primary color and down bar value areas being colored using the secondary color.
NOTE:
This setting does not apply to value area extension, only to per bar value area highlighting (‘Value Area Highlight – High’ and ‘Value Area Highlight – Low’ subgraphs)
If the bar direction cannot be determined from the current chart bar alone, then:
- The bar direction will be determined by the most recent chart bar from the previous, where it is possible to determine the bar direction; or
- If it is not possible to determine the bar direction from the previous three charts bars, then the bar will be considered an up bar.
Adjust Highlighting for Number Bars (In:5)
To prevent the value area highlighting obscuring values displayed when using the number bars study, the value area high and low are adjusted by half of one tick up and down respectively.
Days to Calculate (In:6)
Defines the number of days over which the study is calculated, can be used to reduce the initial study calculation time when many days worth of data is loaded into the chart but this study is only required to be shown on the most recent days.
- Min: 0 (in which case all loaded bars are evaluated during the study calculation)
- Max: 1000000
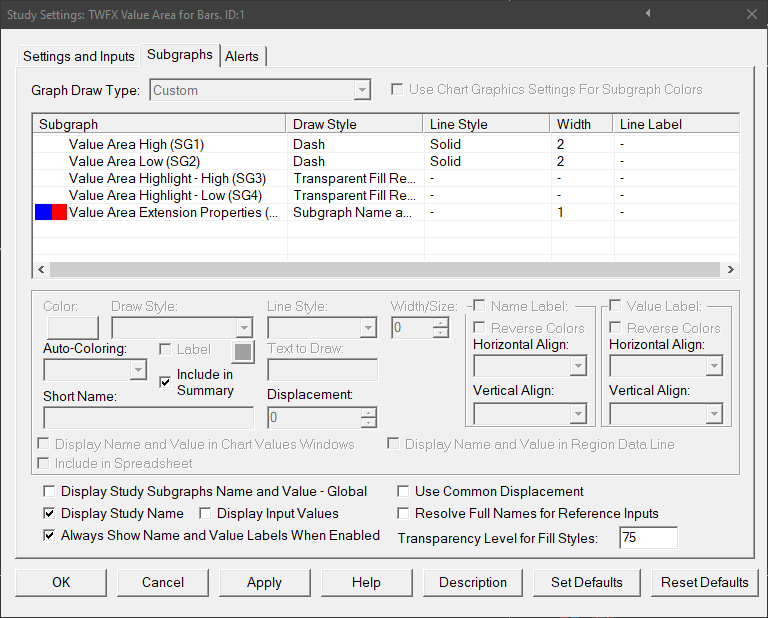
Subgraphs
Value Area High (SG1)
Default: Dash
Displays a line at the value area high for each chart bar.
Value Area Low (SG2)
Default: Dash
Displays a line at the value area low for each chart bar.
Value Area Highlight – High (SG3)
Default: Transparent Fill Rectangle Top
Value Area Highlight – Low (SG4)
Default: Transparent Fill Rectangle Bottom
‘Value Area Highlight – High’ and ‘Value Area Highlight – Low’ subgraphs are used together to draw the value area highlighting for each chart bar, for more information refer to the following link: Top and Bottoms Drawstyles
Value Area Extension Properties (SG5)
Default: Subgraph Name and Value Labels Only
Determine the colors used for value area extensions.
Up bar value area extensions use the primary color, whereas down bar value area extension use the secondary color.
NOTE:
The ‘Transparency Level for Fill Styles’ setting also controls the transparency level used for value area extensions.