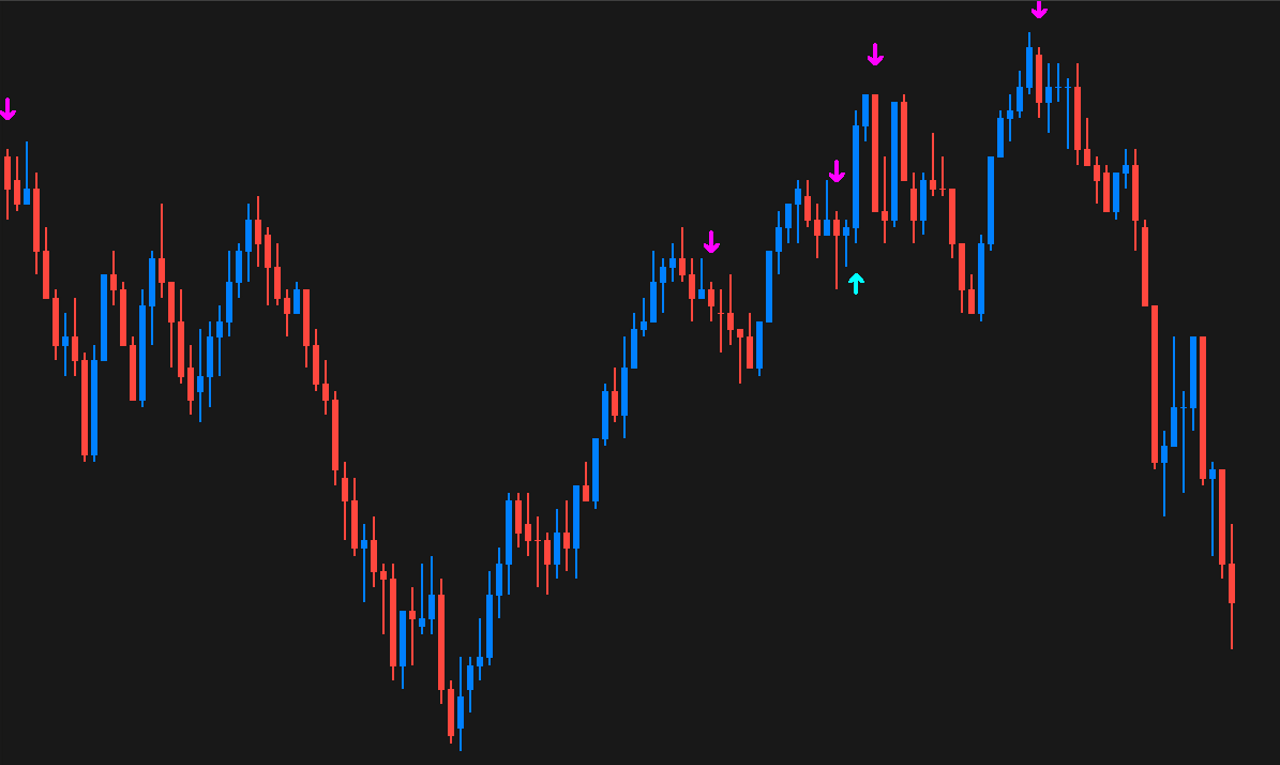
The Bar Delta Surge Study displays an indicator on the chart when the change in Delta from one chart bar to the next exceeds the user defined surge threshold value, highlighting changes in the balance of buying and selling that are in excess of normal operating conditions. For the purposes of this study, Delta is expressed as the percentage of total volume.
It is recommended to use one of the following chart bar types, so that the delta comparison bewteen chart bars is based on similar sets of data: Volume per Bar; Number of Trades per Bar; Range per Bar; or Price Changes per Bar.
Note:
- This study can only be used on charts with a chart data type of ‘Intraday Chart‘
- It is recommended to use ‘Intraday Data Storage Time Unit‘ setting ‘1 Tick’
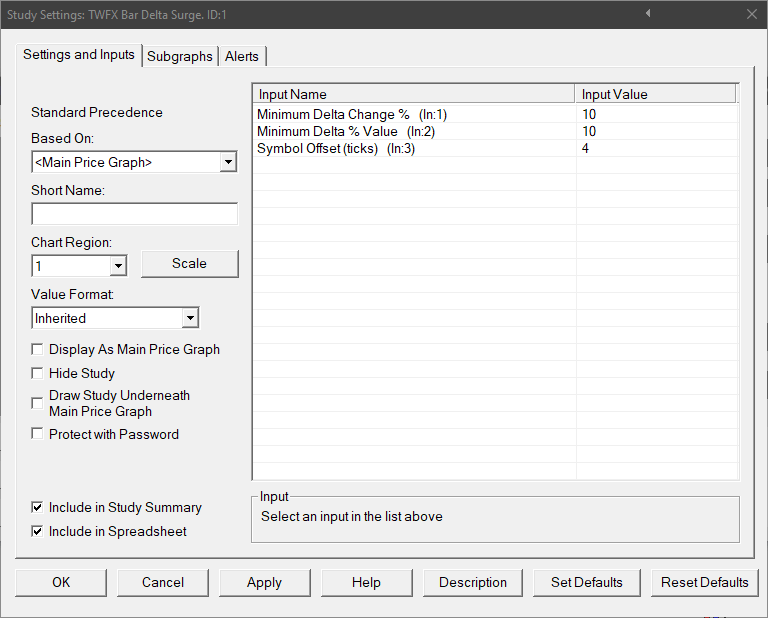
Inputs
Minimum Delta Change % (In:1)
Defines the minimum required change in Delta % from one bar to the next, before the change is considered to be a surge in delta.
- Min: 1
- Max: 100
Minimum Delta % Value (In:2)
Defines the minimum absolute Delta % required in addition to the Minimum Delta Change %.
- Min: 1
- Max: 100
NOTE:
- If Delta % change is positive, Delta % must be greater than or equal to Minimum Delta % Value.
- If Delta % change is negative, Delta % must be less than or equal to 0 – Minimum Delta % Value.
Symbol Offset (ticks) (In:3)
Defines the offset, in ticks, above or below the chart bar at which to draw the delta surge indicator. Delta Surge Positive indicators are drawn below the chart bar, whilst Delta Surge Negative indicators are drawn above the chart bar.
- Min: 0
- Max: 100
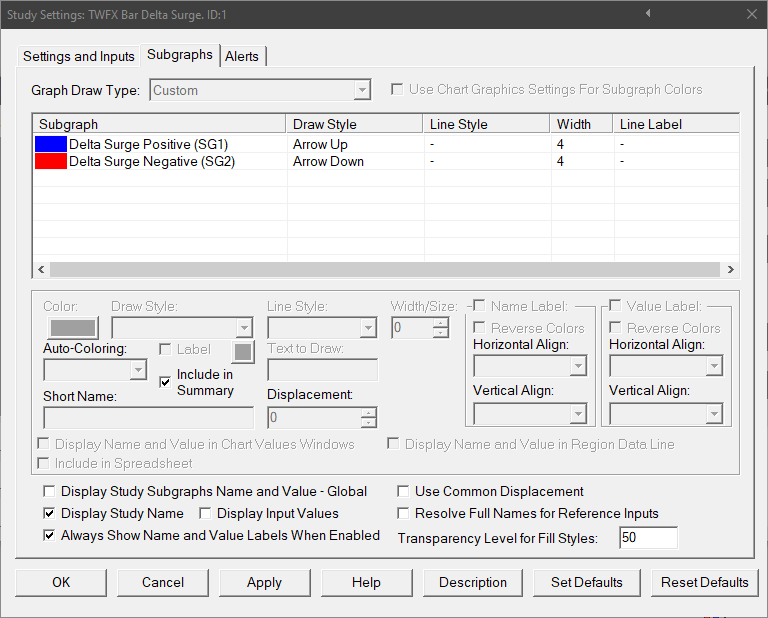
Subgraphs
Delta Surge Positive (SG1)
Default: Arrow Up
Displays an indication when Delta % is positive and exceeds the Minimum Delta % Value, and Delta Change % exceeds the defined threshold.
Delta Surge Negative (SG2)
Default: Arrow Down
Displays an indication when Delta % is negative and exceeds the Minimum Delta % Value, and Delta Change % exceeds the defined threshold.