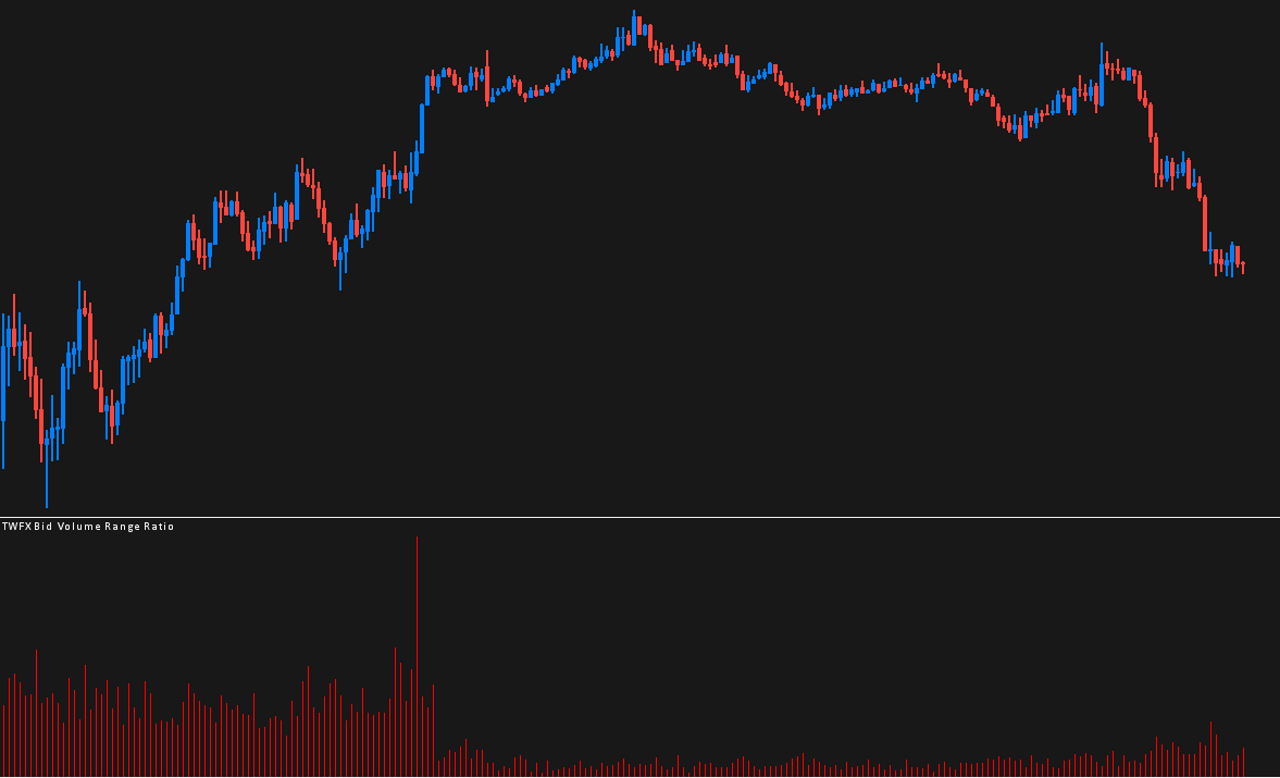
The Bid Volume Range Ratio study displays the total traded bid volume for each chart bar divided by the range of the bar, optionally the study can display as average bid volume per tick.
Note:
- This study can only be used on charts with a chart data type of ‘Intraday Chart‘
- It is recommended to use ‘Intraday Data Storage Time Unit‘ setting ‘1 Tick’
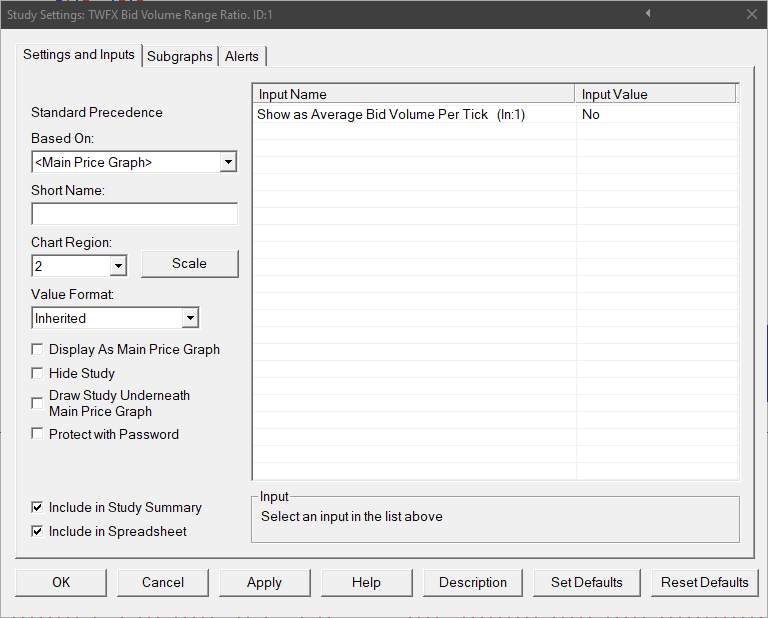
Inputs
Show as Average Bid Volume Per Tick (In:1)
When enabled, the study displays Bid Volume / Bar Range in Ticks, giving the average Bid Volume Per Tick.
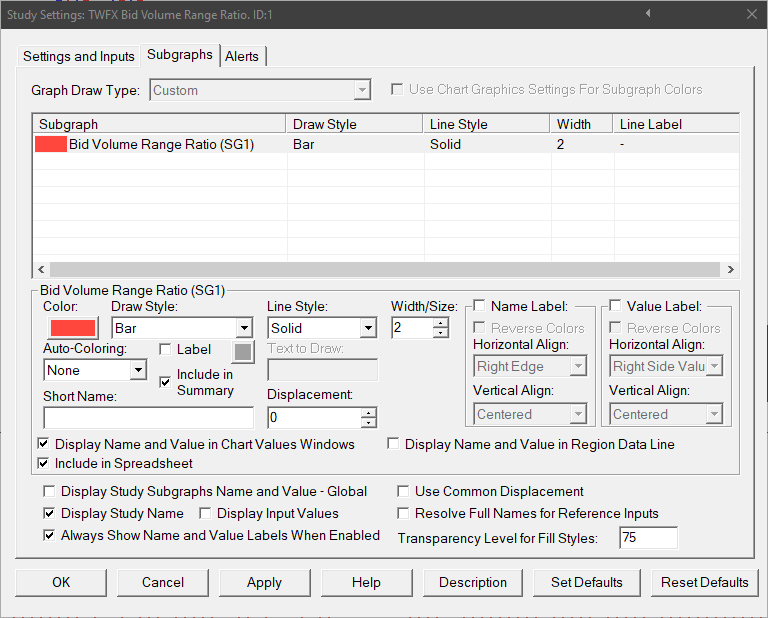
Subgraphs
Bid Volume Range Ratio (SG1)
Default: Bar
Depending on the study configuration, displays either:
- Bid Volume / (Bar High – Bar Low)
- Bid Volume / ((Bar High – Bar Low) / Tick Size)