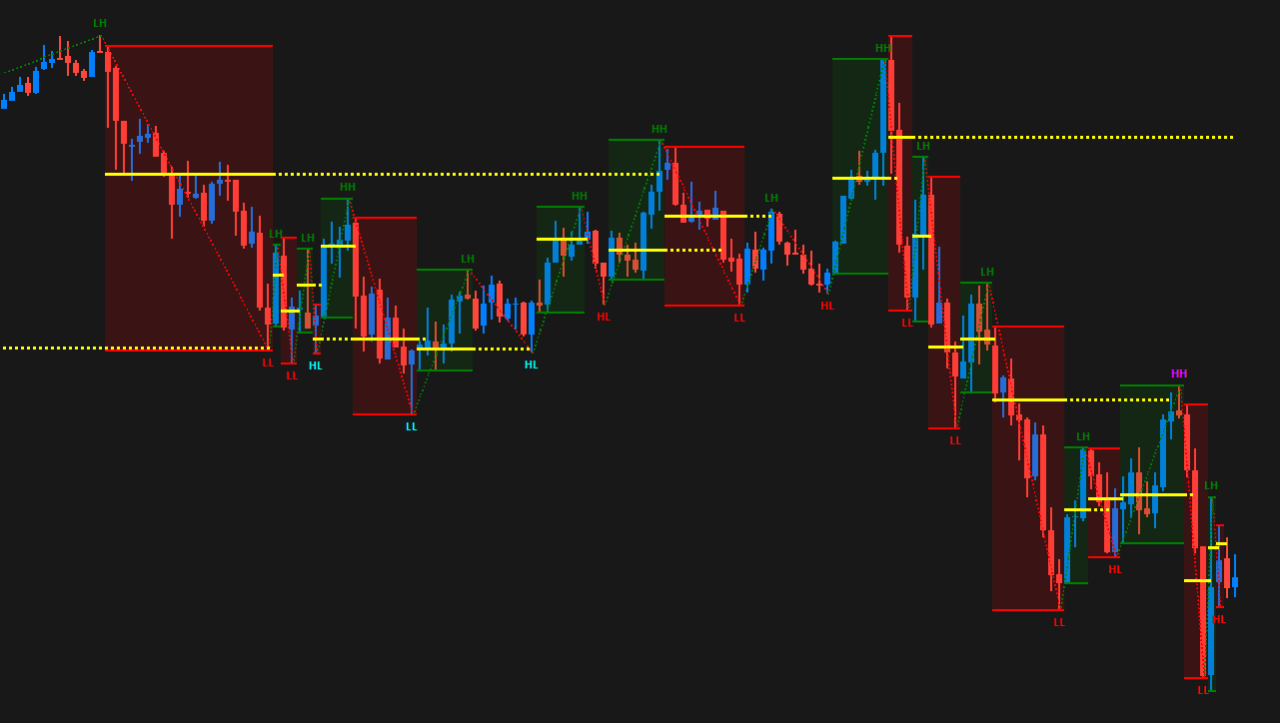
The Zig Zag Box study is based on the calculation method of the native Sierra Chart Zig Zag, as described at the following link – Zig Zag Study, however it is used to highlight the swing direction, high & low, and optionally the point of control and value area high and low.
The study has some similar inputs to the standard study and the zig zag calculation methods are identical.
Note:
- It is recommended to use ‘Intraday Data Storage Time Unit‘ setting ‘1 Tick’
Inputs
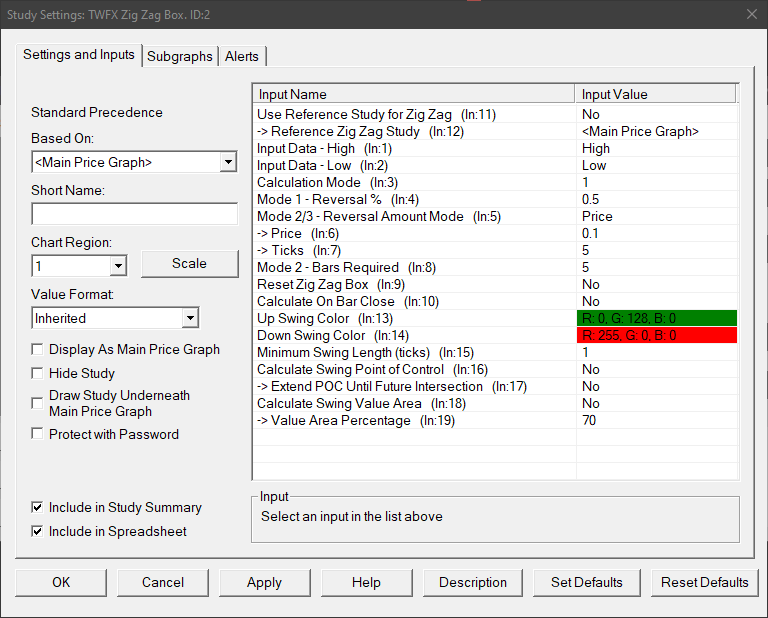
Use Reference Study for Zig Zag (In:11)
When enabled, the study settings relating to zig zag calculation are copied from the main zig zag study (if present). This allows easier synchronization of settings between zig zag type studies.
Reference Zig Zag Study (In:12)
Defines the reference zig zag study with which to link the input settings.
Note: The Zig Zag study drives the settings on the linked studies, not the other way around, therefore when ‘Use Reference Study for Zig Zag’ is enabled, inputs 3 to 13 will always reflect the equivalent inputs on the zig zag study.
Input Data – High (In:1)
Defines the data array to use for High values in the zig zag calculation, for details see – Input Data for High.
Input Data – Low (In:2)
Defines the data array to use for Low values in the zig zag calculation, for details see – Input Data for Low.
Calculation Mode (In:3)
Defines which calculation method is used for the zig zag, for details see – Calculation Mode.
Mode 1 – Reversal % (In:4)
The minimum percentage price change that must occur to begin a new zig zag line when using calculation mode 1.
- Min: 0
- Max: 100
Mode 2/3 – Reversal Amount Mode (In:5)
Determines how the reversal amount for modes 2 and 3 is specified.
- Price
Uses the ‘Price’ input, i.e. the actual price change value. - Ticks
Uses the ‘Ticks’ input, i.e. the price change measured in ticks.
Price (In:6)
Defines the minimum change in price that must occur to begin a new zig zag line when using calculation modes 2 and 3.
- Min: 0
- Max: 3.4028 x 10^38 (max value for single precision floating point variable)
Ticks (In:7)
Defines the minimum price change in ticks that must occur to begin a new zig zag line when using calculation modes 2 and 3.
- Min: 0
- Max: 1000000
Mode 2 – Bars Required (In:8)
Defines the number of price bars required to begin a new zig zag line when using calculation mode 2, see the following link for more details – Calculation Mode 2.
Reset Zig Zag (In:9)
- No
The zig zag calculation is never reset. - Trading Day
The zig zag calculation is reset at the beginning of each trading day, as defined by the chart session times. - Session
The zig zag calculation is reset at the beginning of each trading session, as defined by the chart session times.
Calculate on Bar Close (In:10)
When enabled the zig zag calculation is only updated on the close of the chart bar.
This is useful to avoid a new zig zag line beginning when reversal conditions are only present temporariliy intra-bar, but not at the close of the chart bar.
Up Swing Color (In:13)
Defines the color used for up swing high, low and background fill color.
Down Swing Color (In:14)
Defines the color used for down swing high, low and background fill color.
Minimum Swing Length (ticks) (In:15)
Defines the minimum swing length (in ticks) required for a zig zag box to be drawn.
- Min: 1
- Max: 1000000
Calculate Swing Point of Control (In:16)
When enabled, the ‘Swing Point of Control’ will be calculated and displayed for each zig zag swing. For the purposes of this study, Swing Point of Control is defined as the price within the swing having the greatest total traded volume.
Extend POC Until Future Intersection (In:17)
When enabled, the ‘Swing Point of Control’ line will be projected across the chart into the future, until intersected by another chart bar.
Calculate Swing Value Area (In:18)
When enabled, the ‘Swing Value Area’ will be calculated and displayed for each zig zag swing. For the purposes of this study, Swing Value Area is defined as the range of prices within the swing containing the defined percentage (default: 70%) of total traded volume.
Value Area Percentage (In:19)
Defines the volume percentage taken to constitute the value area.
- Min: 50%
- Max: 100%
Subgraphs
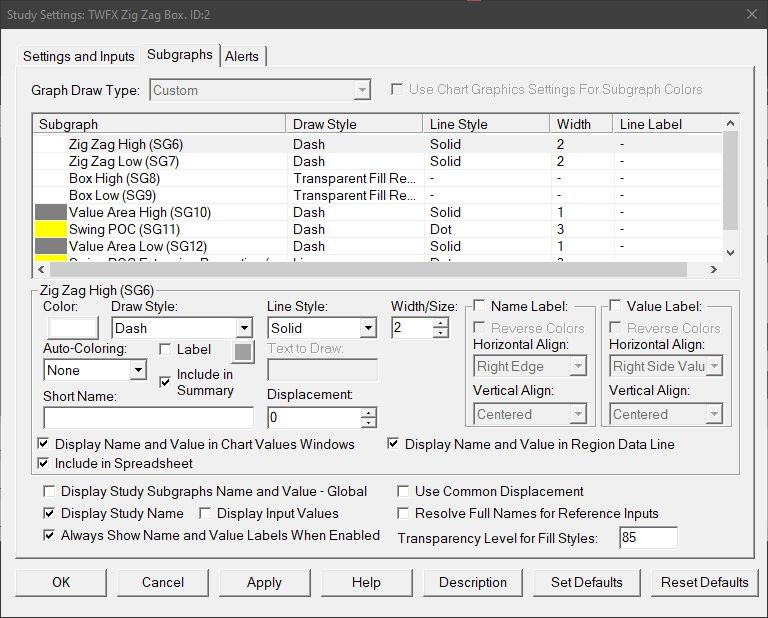
Zig Zag High (SG6)
Default: Dash
Displays a line at the high of each swing box, independently of the highlight box.
Zig Zag Low (SG7)
Default: Dash
Displays a line at the low of each swing box, independently of the highlight box.
Box High (SG8)
Default: Transparent Fill Rectangle Top
Box Low (SG9)
Default: Transparent Fill Rectangle Bottom
Box High and Box Low subgraphs are used together to draw the swing highlight boxes, for more detailed information refer to the following link – Top Bottom Styles
Value Area High (SG10)
Default: Dash
Displays a line at the value area high (when enabled) for each swing box.
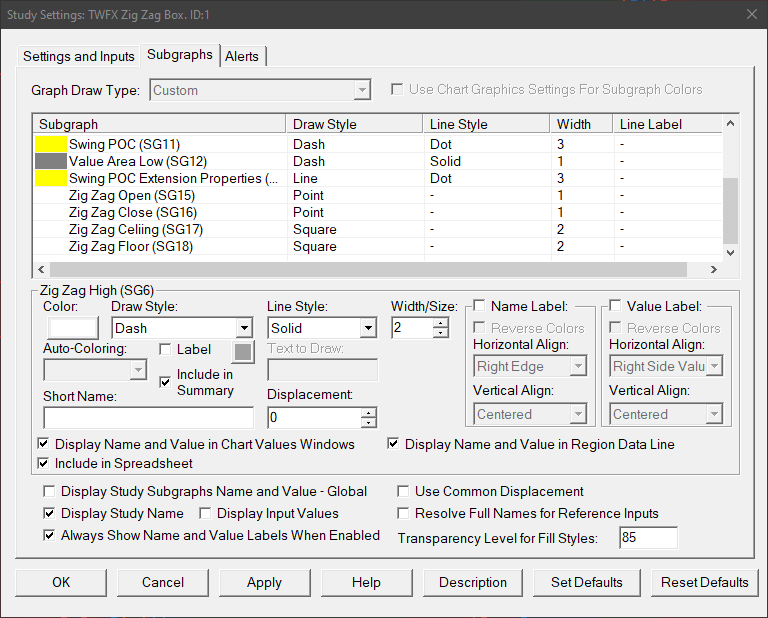
Swing POC (SG11)
Default: Dash
Displays a line at the swing point of control (when enabled) for each swing box.
Value Area Low (SG12)
Default: Dash
Displays a line at the value area low (when enabled) for each swing box.
Swing POC Extension Properties (SG14)
Default: Line
Defines the POC extension line properties: Line Style; Line Width; and Color.
Zig Zag Open (SG15)
Default: Ignore
Stores the opening price of each zig zag swing.
Zig Zag Close (SG16)
Default: Ignore
Stores the closing price of each zig zag swing.
Zig Zag Ceiling (SG17)
Default: Ignore
Stores the highest open or close price for each zig zag swing.
Zig Zag Floor (SG18)
Default: Ignore
Stores the lowest open or close price for each zig zag swing.