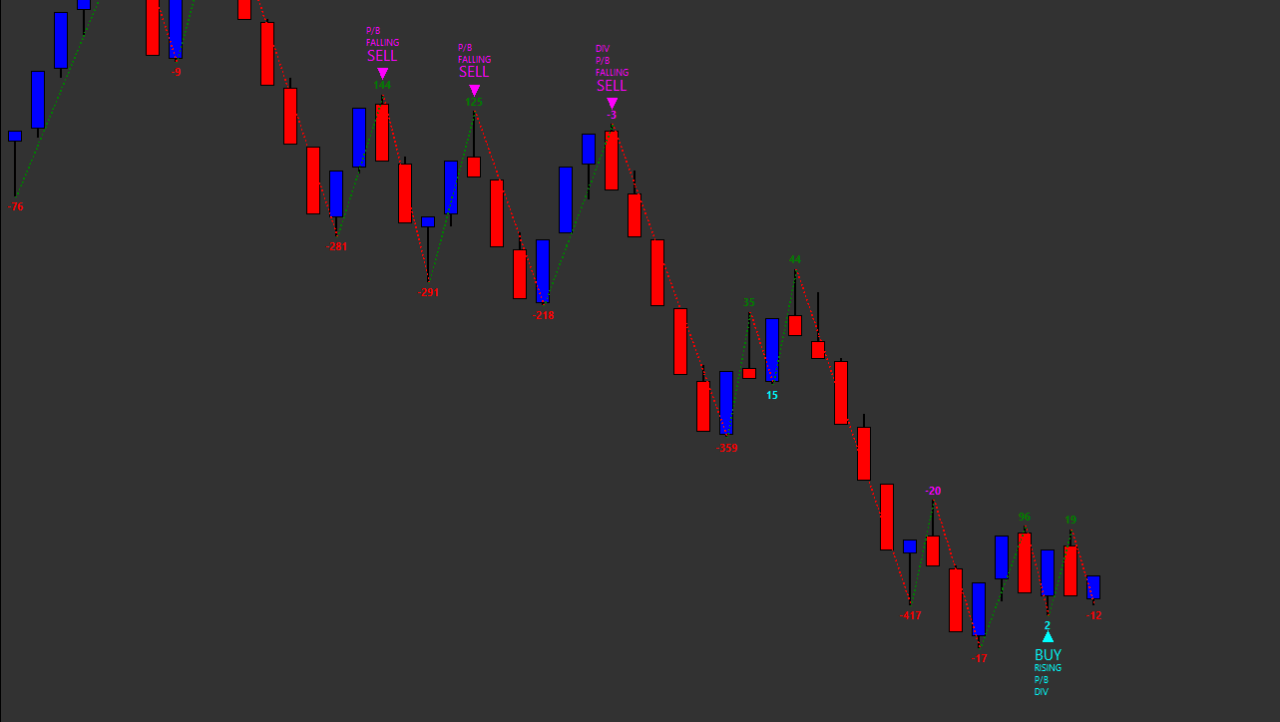
The Zig Zag Delta Signals study is based on the calculation method of the native Sierra Chart Zig Zag, as described at the following link – Zig Zag Study, but it’s is purpose is to provide indications of changes in buying and selling behavior between adjacent zig zag swings.
Signals generated by the study should not necessarily be taken alone as triggers to enter (or exit) trades, rather they should be considered within the overall context of each situation as possible indications of conditions changing from favorable to unfavorable and vice-versa.
Note:
- It is recommended to use ‘Intraday Data Storage Time Unit‘ setting ‘1 Tick’
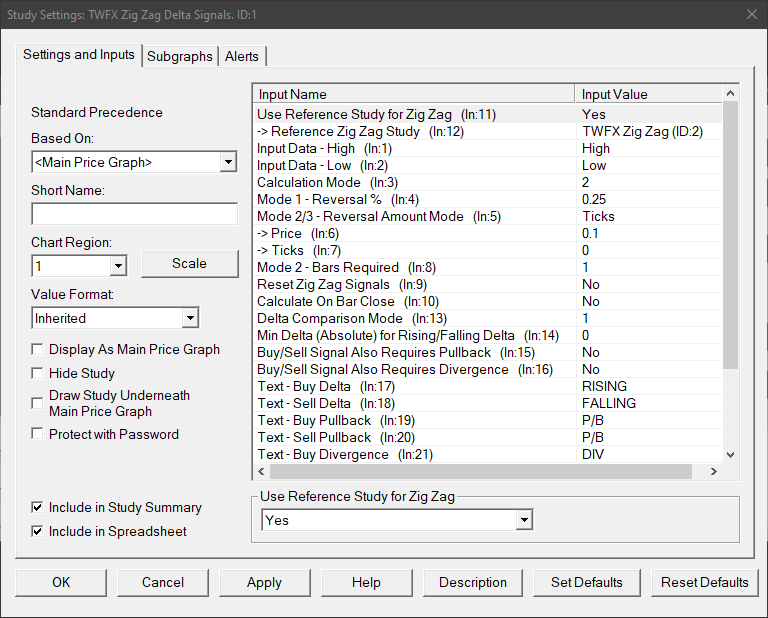
Inputs
Use Reference Study for Zig Zag (In:11)
When enabled, the study settings relating to zig zag calculation are copied from the main zig zag study (if present). This allows easier synchronization of settings between zig zag type studies.
Reference Zig Zag Study (In:12)
Defines the reference zig zag study with which to link the input settings.
Note: The Zig Zag study drives the settings on the linked studies, not the other way around, therefore when ‘Use Reference Study for Zig Zag’ is enabled, inputs 3 to 13 will always reflect the equivalent inputs on the zig zag study.
Input Data – High (In:1)
Defines the data array to use for High values in the zig zag calculation, for details see – Input Data for High.
Input Data – Low (In:2)
Defines the data array to use for Low values in the zig zag calculation, for details see – Input Data for Low.
Calculation Mode (In:3)
Defines which calculation method is used for the zig zag, for details see – Calculation Mode.
Mode 1 – Reversal % (In:4)
The minimum percentage price change that must occur to begin a new zig zag line when using calculation mode 1.
- Min: 0
- Max: 100
Mode 2/3 – Reversal Amount Mode (In:5)
Determines how the reversal amount for modes 2 and 3 is specified.
- Price
Uses the ‘Price’ input, i.e. the actual price change value. - Ticks
Uses the ‘Ticks’ input, i.e. the price change measured in ticks.
Price (In:6)
Defines the minimum change in price that must occur to begin a new zig zag line when using calculation modes 2 and 3.
- Min: 0
- Max: 3.4028 x 10^38 (max value for single precision floating point variable)
Ticks (In:7)
Defines the minimum price change in ticks that must occur to begin a new zig zag line when using calculation modes 2 and 3.
- Min: 0
- Max: 1000000
Mode 2 – Bars Required (In:8)
Defines the number of price bars required to begin a new zig zag line when using calculation mode 2, see the following link for more details – Calculation Mode 2.
Reset Zig Zag (In:9)
- No
The zig zag calculation is never reset. - Trading Day
The zig zag calculation is reset at the beginning of each trading day, as defined by the chart session times. - Session
The zig zag calculation is reset at the beginning of each trading session, as defined by the chart session times.
Calculate on Bar Close (In:10)
When enabled the zig zag calculation is only updated on the close of the chart bar.
This is useful to avoid a new zig zag line beginning when reversal conditions are only present temporariliy intra-bar, but not at the close of the chart bar.
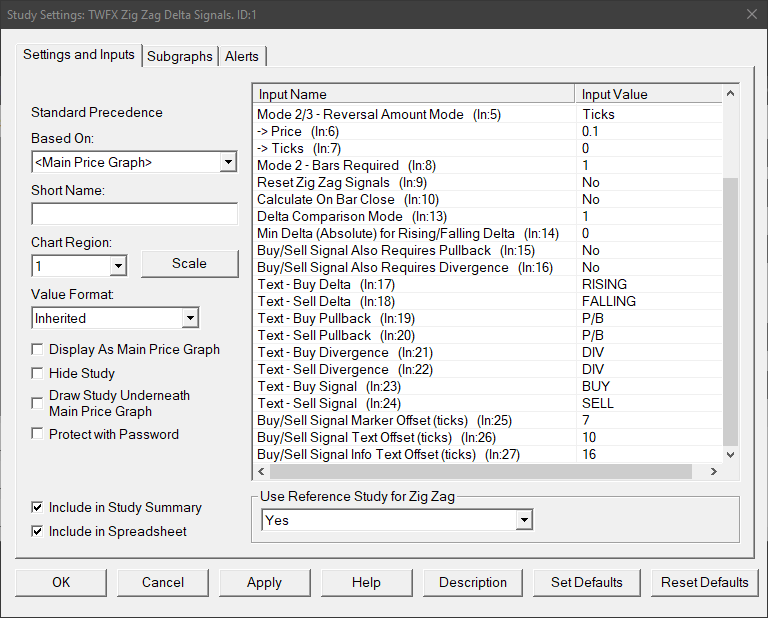
Delta Comparison Mode (In:13)
Defines the method used when comparing adjacent zig zag swings to determine rising / falling delta. ‘Adjacent swings being defined as: ‘A’, ‘B’ & ‘C’ (‘C’ being the most recent) swing highs (or swing lows), i.e. compare swing highs A, B & C or swing lows A, B & C.
Rising
- C > B & B > A
- C >= B & B >= A & C > A
- C >= B & B >= A
Falling
- C < B & B < A
- C <= B & B <= A & C < A
- C <= B & B <= A
Min Delta (Absolute) for Rising/Falling Delta (In:14)
For exmaple, using ‘Min Delta (Absolute) = 50:
Rising Delta is valid if delta in most recent down swing is >= 50
Falling Delta is valid if delta in most recent upswing is <= -50
Min: 0 (Ignore)
Max: 1000000
Buy/Sell Signal Also Requires Pullback (In:15)
When enabled a buy (sell) signal will only be generated if in addition to the rising (falling) delta condition, the current swing is also defined as a Higher Low – HL (Lower High – LH).
Buy/Sell Signal Also Requires Divergence (In:16)
When enabled a buy (sell) signal will only be generated if in addition to the rising (falling) delta condition, the current swing also has divergence between delta and price.
- Buy condition requires bullish divergence – downswing with positive delta.
- Sell condition requires bearish divergence – upswing with negative delta.
Text – Buy Delta (In:17)
Defines the text to display when Buy Delta conditions are present.
Text – Sell Delta (In:18)
Defines the text to display when Sell Delta conditions are present.
Text – Buy Pullback (In:19)
Defines the text to display when Buy Pullback conditions are present.
Text – Sell Pullback (In:20)
Defines the text to display when Sell Pullback conditions are present.
Text – Buy Divergence (In:21)
Defines the text to display when Buy Divergence conditions are present.
Text – Sell Divergence (In:22)
Defines the text to display when Sell Divergence conditions are present.
Text – Buy Signal (In:23)
Defines the text to display to indicate a Buy signal.
Text – Sell Signal (In:24)
Defines the text to display to indicate a Sell signal.
Buy/Sell Signal Marker Offset (ticks) (In:25)
Defines the offset from swing high/low in ticks at which to display the buy/sell markers.
- Min: 0
- Max: 100
Buy/Sell Signal Text Offset (ticks) (In:26)
Defines the offset from swing high/low in ticks at which to display the buy/sell signal text.
- Min: 0
- Max: 100
Buy/Sell Signal Info Text Offset (ticks) (In:27)
Defines the offset from swing high/low in ticks at which to display the buy/sell signal information text (rising/falling, pullback, divergence).
- Min: 0
- Max: 100
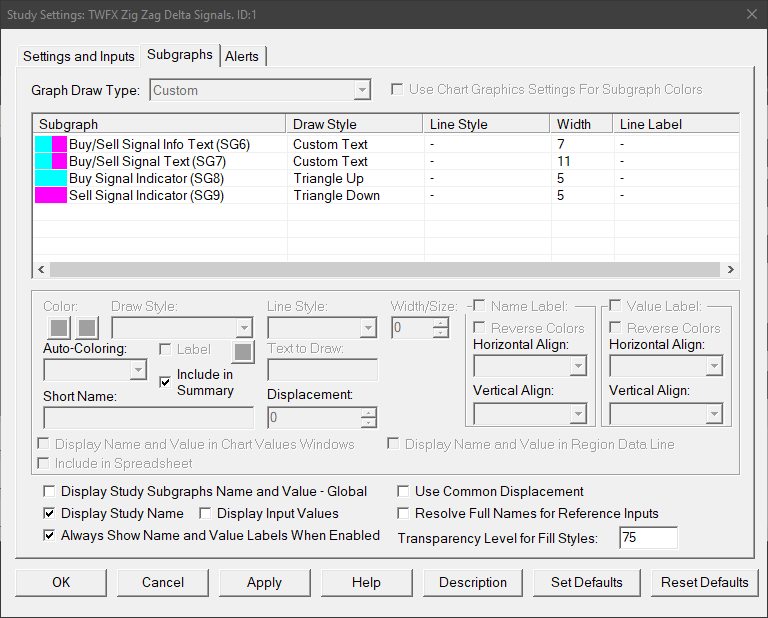
Subgraphs
Buy/Sell Signal Info Text (SG6)
Default: Custom Text
Defines the formatting for signal information labels, primary color used for up swing labels, secondary color used for down swing labels.
Buy/Sell Signal Text (SG7)
Default: Custom Text
Defines the formatting for signal labels, primary color used for up swing labels, secondary color used for down swing labels.
Buy Signal Indicator (SG8)
Default: Triangle Up
Displays and indication when buy signal conditions have been met.
Sell Signal Indicator (SG9)
Default: Triangle Down
Displays and indication when sell signal conditions have been met.