The Zig Zag study is modified version of the native Sierra Chart Zig Zag Cumulative Volume study, as described at the following link – Zig Zag Cumulative Volume.
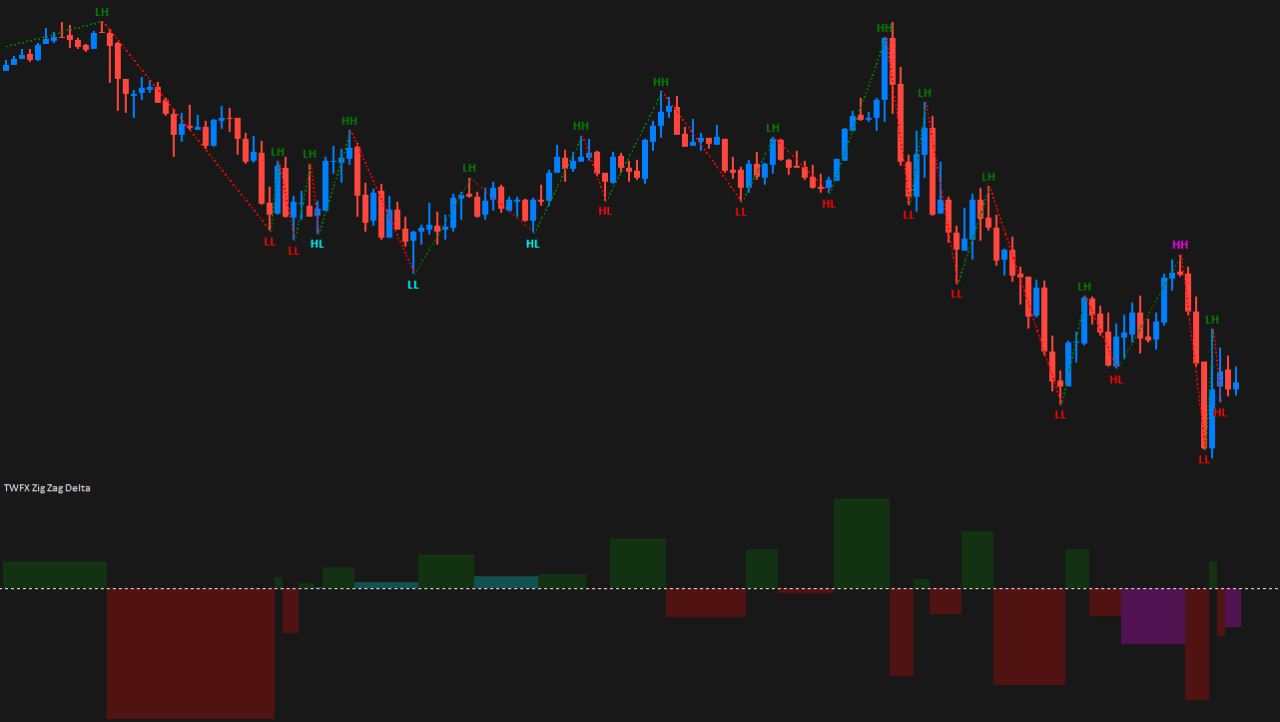
Overall the study is similar to the standard study, the calculation methods are identical and many of the options are also mirrored between the studies. Unlike the native study, this study is specifically for accumulated Delta Volume (Ask Volume – Bid Volume), separate studies are provided for Ask Volume, Bid Volume and Volume.
Note:
- It is recommended to use ‘Intraday Data Storage Time Unit‘ setting ‘1 Tick’
Inputs
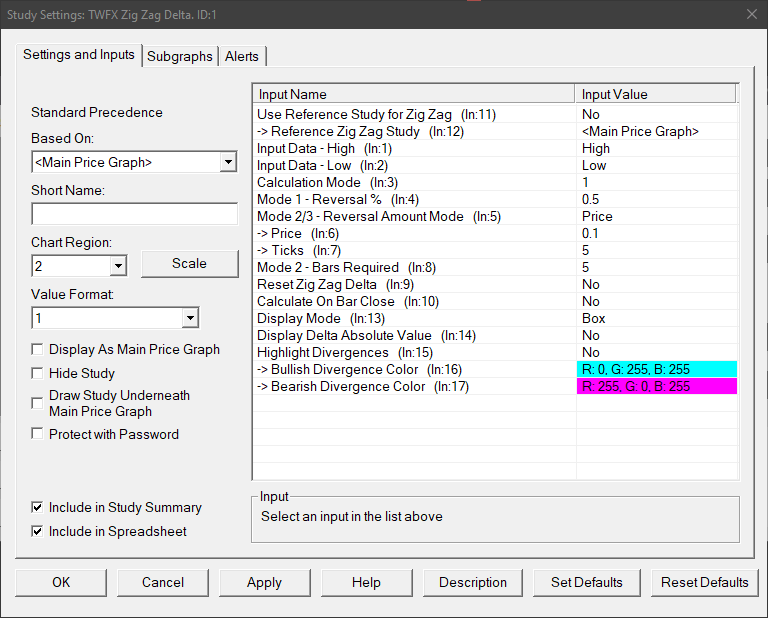
Use Reference Study for Zig Zag (In:11)
When enabled, the study settings relating to zig zag calculation are copied from the main zig zag study (if present). This allows easier synchronization of settings between zig zag type studies.
Reference Zig Zag Study (In:12)
Defines the reference zig zag study with which to link the input settings.
Note: The Zig Zag study drives the settings on the linked studies, not the other way around, therefore when ‘Use Reference Study for Zig Zag’ is enabled, inputs 3 to 13 will always reflect the equivalent inputs on the zig zag study.
Input Data – High (In:1)
Defines the data array to use for High values in the zig zag calculation, for details see – Input Data for High.
Input Data – Low (In:2)
Defines the data array to use for Low values in the zig zag calculation, for details see – Input Data for Low.
Calculation Mode (In:3)
Defines which calculation method is used for the zig zag, for details see – Calculation Mode.
Mode 1 – Reversal % (In:4)
The minimum percentage price change that must occur to begin a new zig zag line when using calculation mode 1.
- Min: 0
- Max: 100
Mode 2/3 – Reversal Amount Mode (In:5)
Determines how the reversal amount for modes 2 and 3 is specified.
- Price
Uses the ‘Price’ input, i.e. the actual price change value. - Ticks
Uses the ‘Ticks’ input, i.e. the price change measured in ticks.
Price (In:6)
Defines the minimum change in price that must occur to begin a new zig zag line when using calculation modes 2 and 3.
- Min: 0
- Max: 3.4028 x 10^38 (max value for single precision floating point variable)
Ticks (In:7)
Defines the minimum price change in ticks that must occur to begin a new zig zag line when using calculation modes 2 and 3.
- Min: 0
- Max: 1000000
Mode 2 – Bars Required (In:8)
Defines the number of price bars required to begin a new zig zag line when using calculation mode 2, see the following link for more details – Calculation Mode 2.
Reset Zig Zag (In:9)
- No
The zig zag calculation is never reset. - Trading Day
The zig zag calculation is reset at the beginning of each trading day, as defined by the chart session times. - Session
The zig zag calculation is reset at the beginning of each trading session, as defined by the chart session times.
Calculate on Bar Close (In:10)
When enabled the zig zag calculation is only updated on the close of the chart bar.
This is useful to avoid a new zig zag line beginning when reversal conditions are only present temporariliy intra-bar, but not at the close of the chart bar.
Display Mode (In:13)
Defines how the zig zag delta volume should be displayed on the chart.
- Histogram
Volume delta is accumulated as the zig zag progresses, each chart bar displays the accumulated delta at the close of the bar. - Box
Volume delta is accumulated as the zig zag progresses, each chart bar is updated to always display the total accumulated delta for the swing.
Display Delta Absolute Value (In:14)
When enabled, accumulated delta volume is displayed as positive values, regardless of delta sign, otherwise negative delta is shown as negative.
Highlight Divergences (In:15)
When enabled the colors defined by ‘Bullish Divergence Color’ and ‘Bearish Divergence Color’ will be used to color delta bars if divergence is present in the associated swing.
Bullish Divergence Color (In:16)
Defines the color used to highlight bullish delta divergence.
Bearish Divergence Color (In:17)
Defines the color used to highlight bearish delta divergence.
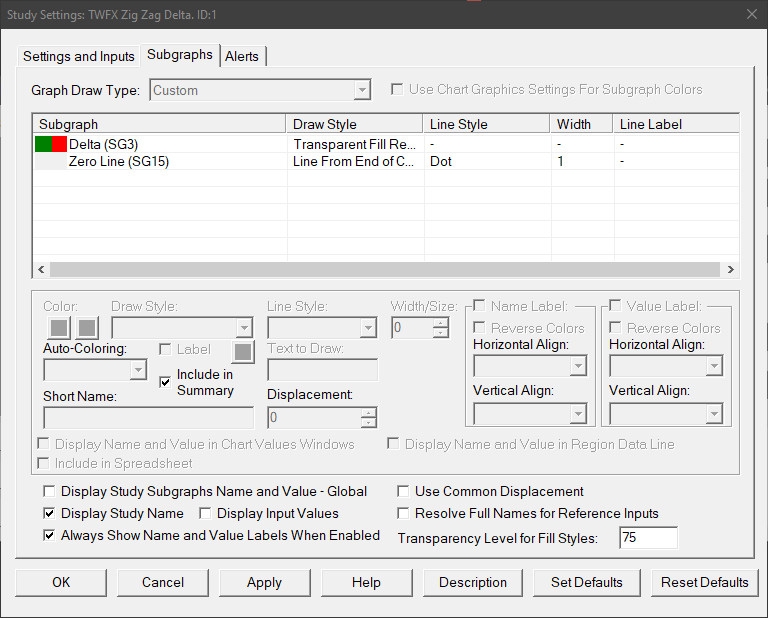
Subgraphs
Delta (SG3)
Default: Transparent Fill Rectangle to Zero
Displays the accumulated delta volume for each zig zag swing.
Primary color is used for positive delta, secondary color for negative delta.
Zero Line (SG15)
Default: Line from End of Chart Left to Right
Displays line at zero when ‘Display Delta Absolute Value’ is disabled.