The Zig Zag Box study is based on the calculation method of the native Sierra Chart Zig Zag, as described at the following link – Zig Zag Study, however it is used to draw fibonacci retracements of zig zag swings.
The study has some similar inputs to the standard study and the zig zag calculation methods are identical.
Note:
- It is recommended to use ‘Intraday Data Storage Time Unit‘ setting ‘1 Tick’
Inputs
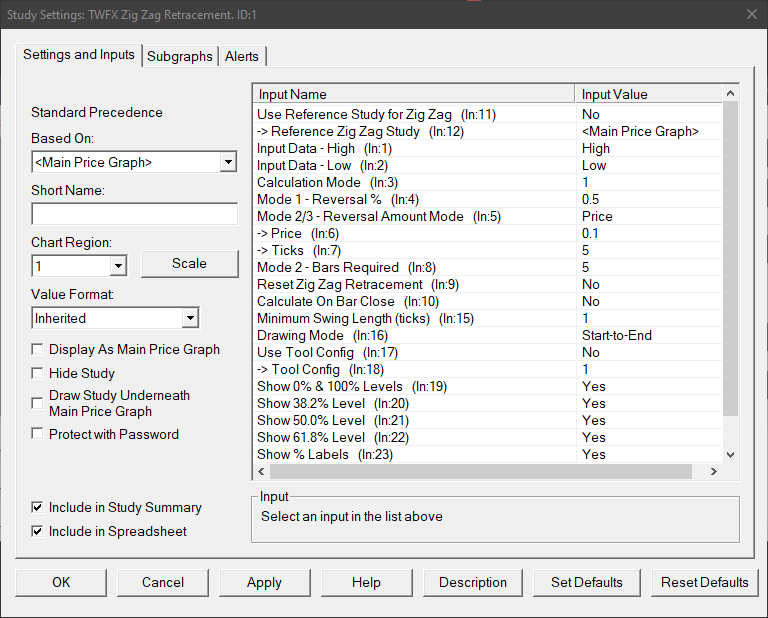
Use Reference Study for Zig Zag (In:11)
When enabled, the study settings relating to zig zag calculation are copied from the main zig zag study (if present). This allows easier synchronization of settings between zig zag type studies.
Reference Zig Zag Study (In:12)
Defines the reference zig zag study with which to link the input settings.
Note: The Zig Zag study drives the settings on the linked studies, not the other way around, therefore when ‘Use Reference Study for Zig Zag’ is enabled, inputs 3 to 13 will always reflect the equivalent inputs on the zig zag study.
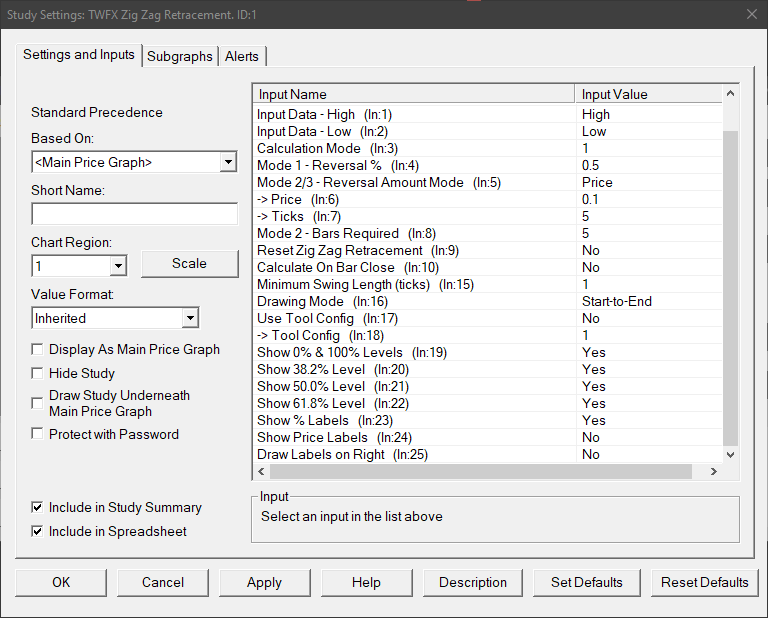
Input Data – High (In:1)
Defines the data array to use for High values in the zig zag calculation, for details see – Input Data for High.
Input Data – Low (In:2)
Defines the data array to use for Low values in the zig zag calculation, for details see – Input Data for Low.
Calculation Mode (In:3)
Defines which calculation method is used for the zig zag, for details see – Calculation Mode.
Mode 1 – Reversal % (In:4)
The minimum percentage price change that must occur to begin a new zig zag line when using calculation mode 1.
- Min: 0
- Max: 100
Mode 2/3 – Reversal Amount Mode (In:5)
Determines how the reversal amount for modes 2 and 3 is specified.
- Price
Uses the ‘Price’ input, i.e. the actual price change value. - Ticks
Uses the ‘Ticks’ input, i.e. the price change measured in ticks.
Price (In:6)
Defines the minimum change in price that must occur to begin a new zig zag line when using calculation modes 2 and 3.
- Min: 0
- Max: 3.4028 x 10^38 (max value for single precision floating point variable)
Ticks (In:7)
Defines the minimum price change in ticks that must occur to begin a new zig zag line when using calculation modes 2 and 3.
- Min: 0
- Max: 1000000
Mode 2 – Bars Required (In:8)
Defines the number of price bars required to begin a new zig zag line when using calculation mode 2, see the following link for more details – Calculation Mode 2.
Reset Zig Zag (In:9)
- No
The zig zag calculation is never reset. - Trading Day
The zig zag calculation is reset at the beginning of each trading day, as defined by the chart session times. - Session
The zig zag calculation is reset at the beginning of each trading session, as defined by the chart session times.
Calculate on Bar Close (In:10)
When enabled the zig zag calculation is only updated on the close of the chart bar.
This is useful to avoid a new zig zag line beginning when reversal conditions are only present temporariliy intra-bar, but not at the close of the chart bar.
Up Swing Color (In:13)
Defines the color used for up swing retracements.
Down Swing Color (In:14)
Defines the color used for down swing retracements.
Minimum Swing Length (ticks) (In:15)
Defines the minimum swing length (in ticks) required for a zig zag retracement to be drawn.
- Min: 1
- Max: 1000000
Drawing Mode (In:16)
Defines how the high and low values for the zig zag retracement are determined.
- Start-to-End
Starts at high/low of the first bar in the swing, and finishes at the last high/low in the swing.
Note: Depending on the configuration of the zig zag calculation, the high/low may not always be the highest high / lowest low within the zig zag swing. - End-to-End
Starts at the high/low of the last bar in the previous swing, and finishes at the last high/low in the swing. - Highest/Lowest
Starts at high/low of the first bar in the swing, and finishes at the last high/low in the swing.
If the initial high/low level is exceeded during the swing, then that is used instead.
Use Tool Config (In:17)
When enabled the selected ‘Tool Config’ is used to determine the configuration of the zig zag retracement drawing.
Note: When ‘Use Tool Config’ is enabled, inputs 19-25 are ignored, as are the subgraph colors.
Tool Config (In:18)
Defines the tool config to use for drawing the zig zag retracement.
- Min: 1
- Max: 24
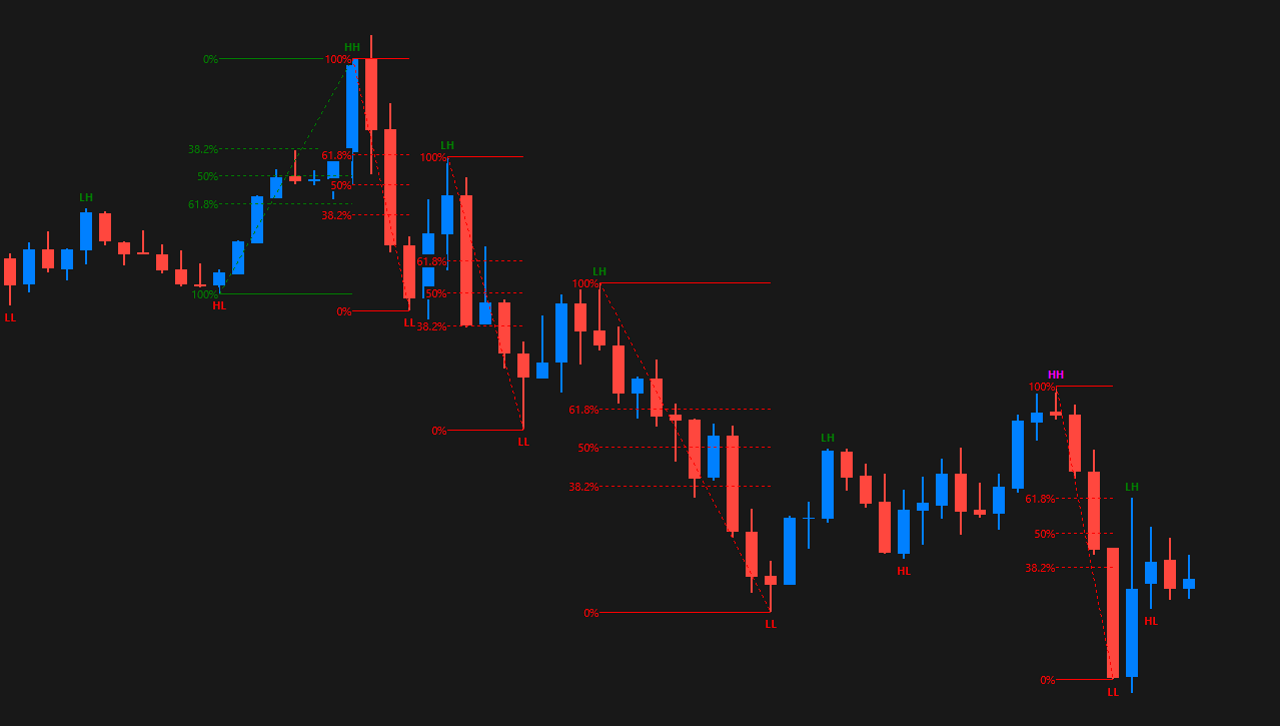
Show 0% & 100% Levels (In:19)
When enabled, the 0% & 100% levels are drawn for the zig zag retracement.
Show 38.2% Level (In:20)
When enabled, the 38.2% retracement level is drawn for the zig zag retracement.
Show 50.0% Level (In:21)
When enabled, the 50.0% retracement level is drawn for the zig zag retracement.
Show 61.8% Level (In:22)
When enabled, the 61.8% retracement level is drawn for the zig zag retracement.
Show % Labels (In:23)
When enabled, percentage labels are displayed at each level of the zig zag retracement.
Show Price Labels (In:24)
When enabled, price labels are displayed at each level of the zig zag retracement.
Draw Labels on Right (In:25)
When enabled, percentage and/or price labels are displayed at the right hand side of each level of the zig zag retracement.
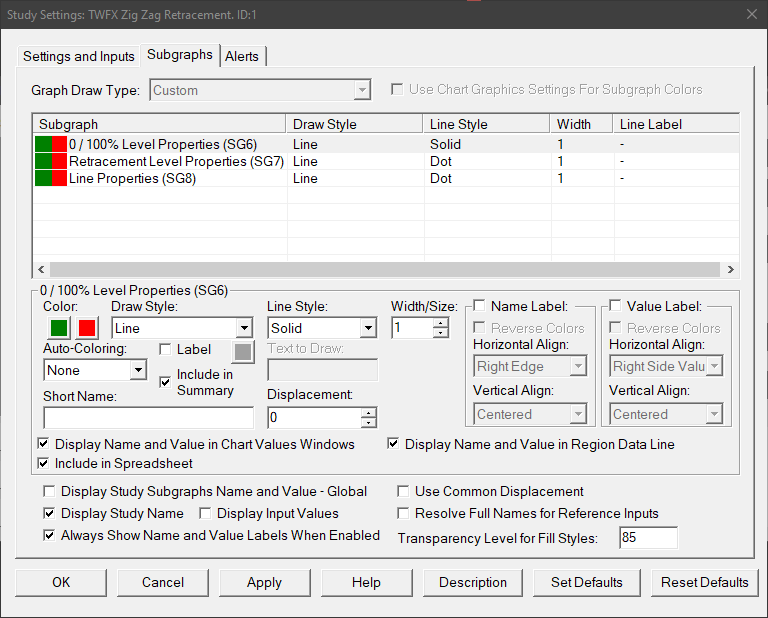
Subgraphs
0 / 100% Level Properties (SG6)
Default: Line
Defines the 0 / 100% level properties: Line Style; Line Width; and Color.
Primary color is used for up swings, secondary color for down swings.
Retracement Level Properties (SG7)
Default: Line
Defines the 38.2%, 50.0% and 61.8% level properties: Line Style; Line Width; and Color.
Primary color is used for up swings, secondary color for down swings.
Line Properties (SG8)
Default: Line
Defines retracement high to low line properties: Line Style; Line Width; and Color.
Primary color is used for up swings, secondary color for down swings.