The Zig Zag study is modified version of the native Sierra Chart Zig Zag study, as described at the following link – Zig Zag Study.
Overall the study is actually very similar to the standard study, for instance the calculation methods are identical and many of the display options are also mirrored between the studies. Unlike the native study, this study allows simultaneous accumulation of Volume, Ask Volume, Bid Volume and Volume Delta, should it be required. There is also the option to color the information labels differently when price direction and volume delta diverge.
Note:
- It is recommended to use ‘Intraday Data Storage Time Unit‘ setting ‘1 Tick’
Inputs
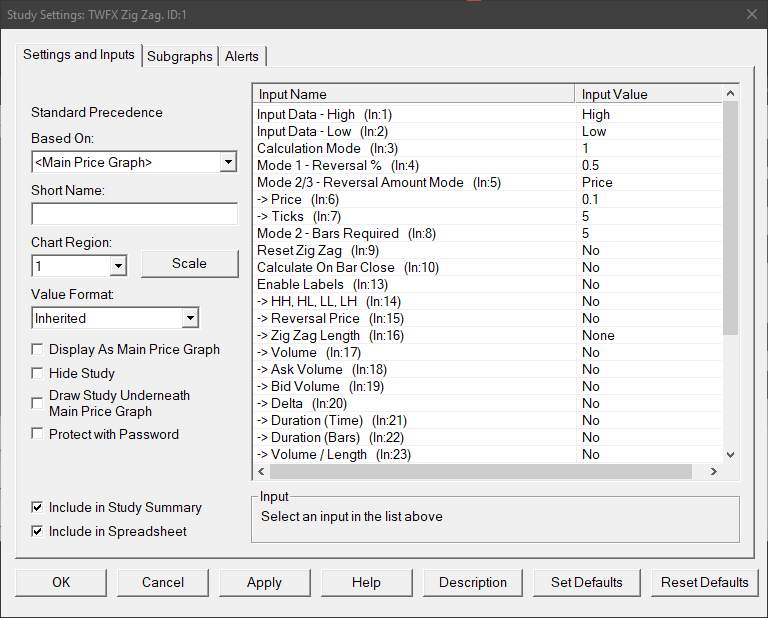
Input Data – High (In:1)
Defines the data array to use for High values in the zig zag calculation, for details see – Input Data for High.
Input Data – Low (In:2)
Defines the data array to use for Low values in the zig zag calculation, for details see – Input Data for Low.
Calculation Mode (In:3)
Defines which calculation method is used for the zig zag, for details see – Calculation Mode.
Mode 1 – Reversal % (In:4)
The minimum percentage price change that must occur to begin a new zig zag line when using calculation mode 1.
- Min: 0
- Max: 100
Mode 2/3 – Reversal Amount Mode (In:5)
Determines how the reversal amount for modes 2 and 3 is specified.
- Price
Uses the ‘Price’ input, i.e. the actual price change value. - Ticks
Uses the ‘Ticks’ input, i.e. the price change measured in ticks.
Price (In:6)
Defines the minimum change in price that must occur to begin a new zig zag line when using calculation modes 2 and 3.
- Min: 0
- Max: 3.4028 x 10^38 (max value for single precision floating point variable)
Ticks (In:7)
Defines the minimum price change in ticks that must occur to begin a new zig zag line when using calculation modes 2 and 3.
- Min: 0
- Max: 1000000
Mode 2 – Bars Required (In:8)
Defines the number of price bars required to begin a new zig zag line when using calculation mode 2, see the following link for more details – Calculation Mode 2.
Reset Zig Zag (In:9)
- No
The zig zag calculation is never reset. - Trading Day
The zig zag calculation is reset at the beginning of each trading day, as defined by the chart session times. - Session
The zig zag calculation is reset at the beginning of each trading session, as defined by the chart session times.
Calculate on Bar Close (In:10)
When enabled the zig zag calculation is only updated on the close of the chart bar.
This is useful to avoid a new zig zag line beginning when reversal conditions are only present temporariliy intra-bar, but not at the close of the chart bar.
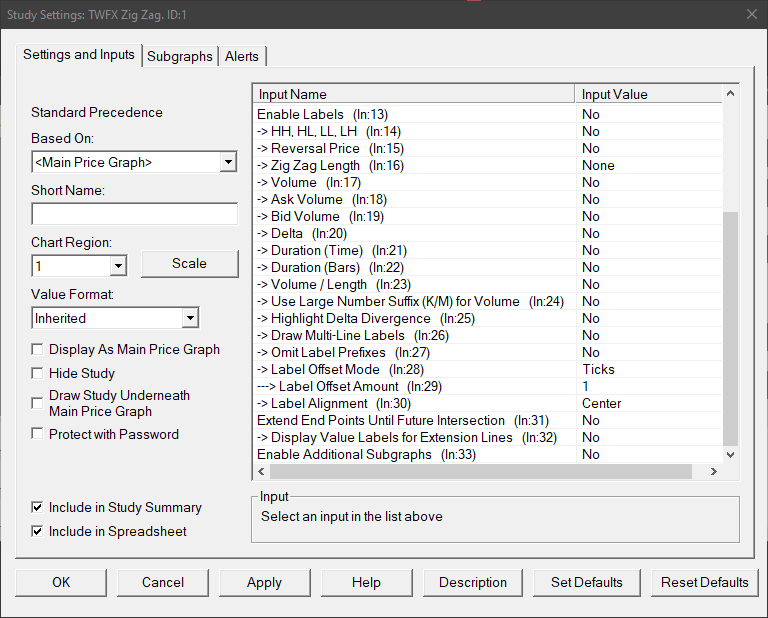
Enable Labels (In:13)
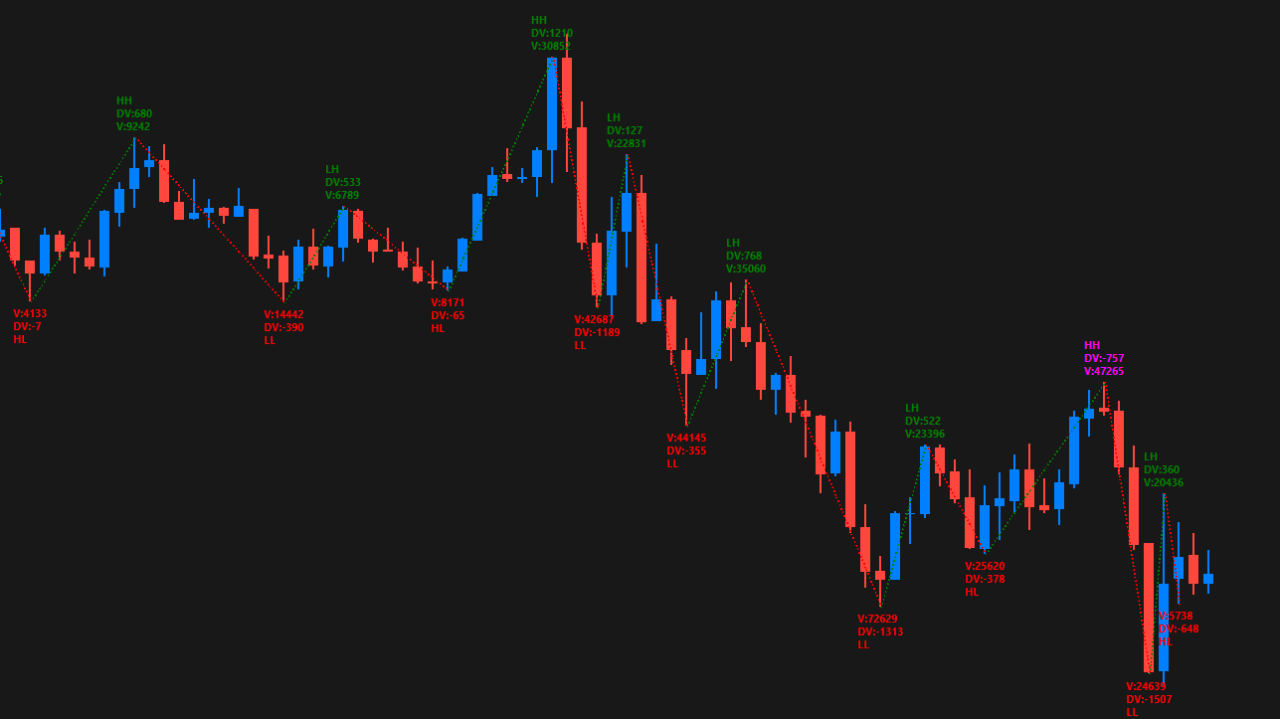
When enabled, information labels will be displayed above/below zig zag swing highs/lows, the actual information displayed is controlled by inputs 14 to 24.
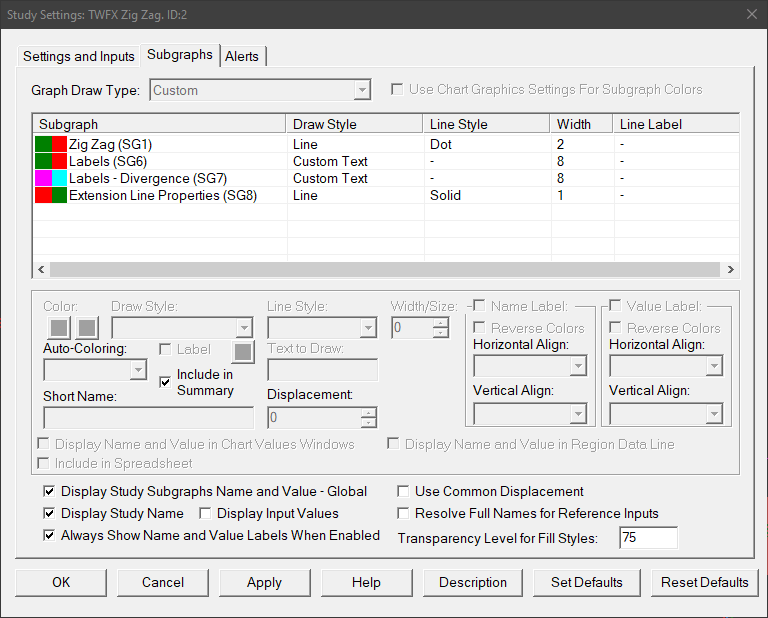
Inputs 25 to 30 provide some formatting options, whilst the general appearance of the labels is controlled via the ‘Labels’ (SG6) and ‘Labels – Divergence’ (SG7) subgraphs.
HH, HL, LL, LH (In:14)
When enabled, HH (Higher High), HL (Higher Low), LL (Lower Low) and LH (Lower High) labels will be displayed (similarly to the standard Zig Zag study).
Reversal Price (In:15)
When enabled, then at the chart bar where the zig zag reverses direction, the price value of the high or low will be displayed.
Zig Zag Length (In:16)
When set to a value other than ‘None’, the price difference between the ends of the zig zag line will be displayed as specified, prefix ‘L:’, if not disabled.
- None
Length value is not displayed. - Ticks
Length value is displayed in ticks (suffix T). - Points
Length value is displayed as the actual numerical difference (suffix P). - Percent
Length value is displayed as a percentage of the most recent price (suffix %).
Volume (In:17)
When enabled, the zig zag accumulated volume will be displayed, prefix ‘V:’, if not disabled.
Ask Volume (In:18)
When enabled, the zig zag accumulated ask volume will be displayed, prefix ‘AV:’, if not disabled.
Bid Volume (In:19)
When enabled, the zig zag accumulated bid volume will be displayed, prefix ‘BV:’, if not disabled.
Delta (In:20)
When enabled, the zig zag accumulated delta volume will be displayed, prefix ‘DV:’, if not disabled.
Duration (Time) (In:21)
When enabled, the elapsed time between each zig zag swing high and low will be displayed, prefix ‘D:’, if not disabled.
Duration (Bars) (In:22)
When enabled, the number of chart bars between each zig zag swing high and low will be displayed, prefix ‘B:’, if not disabled.
Volume / Length (In:23)
When set to a value other than ‘None’, the specified volume value divided by the length of the zig zag line (in ticks) will be calculated and displayed.
- None
No Value is displayed. - Volume/Length
The accumulated volume divided by the zig zag length (in ticks) is displayed, prefix ‘V/L:’, if not disabled. - Delta/Length
The accumulated delta volume divided by the zig zag length (in ticks) is displayed, prefix ‘DV/L:’, if not disabled.
Use Large Number Suffix (K/M) for Volume (In:24)
When enabled, accumulated volume values will be automatically displayed in units of 1, 1000 (K), or 1000000 (M) as appropriate.
Highlight Delta Divergence (In:25)
When enabled, the accumulated volume delta for each zig zag swing is compare to the direction of the swing. If delta and price movement are in opposition i.e. swing high has negative delta, or swing low has positive delta, then the label will be formatted based on the ‘Labels – Divergence’ (SG7) subgraph.
Draw Multi-Line Labels (In:26)
When enabled, each label value will be drawn on a separate line.
Omit Label Prefixes (In:27)
When enabled, only label values will be displayed, no identifying prefix will be shown.
Label Offset Mode (In:28)
Determines how the label offset from the chart bars is calculated.
- Ticks
Labels are offset by specified number of ticks. - Percentage of Bar
Label offset is calculated as a percentage of the most recent chart bar.
Label Offset Amount (In:29)
Defines the offset value to used when calculating the label positions.
- Min: 0
- Max: 1000000
Label Alignment (In:30)
Defines the text alignment mode used when drawing the information labels, options: ‘Left‘; ‘Center‘; and ‘Right‘.
Extend End Points Until Future Intersection (In:31)
When enabled, a line will be drawn from each zig zag swing end point, until the point where it is intersected by a price bar in the future.
Display Value Labels for Extension Lines (In:32)
Defines whether extension lines should also display a value label, which will either appear in the right hand side values scale for non-intersected lines, or at the point of intersection for intersected lines.
Enable Additional Subgraphs (In:33)
Enables subgraphs containing various values pertaining to the zig zag swings. The subgraphs are always populated with data whether enabled or not, however enabling them allows easier reference for other studies, and for constructing alert formulae.
Subgraphs
Zig Zag (SG1)
Default: Line
Displays a line connecting the zig zag swing high and low points
Accumulated Volume (SG2)
Default: Ignore (not shown unless ‘Enable Additional Subgraphs’ is set to yes).
Stores the accumulated volume for each zig zag swing.
Accumulated Delta (SG3)
Default: Ignore (not shown unless ‘Enable Additional Subgraphs’ is set to yes).
Stores the accumulated volume delta for each zig zag swing.
Accumulated Ask Volume (SG4)
Default: Ignore (not shown unless ‘Enable Additional Subgraphs’ is set to yes).
Stores the accumulated ask volume for each zig zag swing.
Accumulated Bid Volume (SG5)
Default: Ignore (not shown unless ‘Enable Additional Subgraphs’ is set to yes).
Stores the accumulated bid volume for each zig zag swing.
Labels (SG6)
Default: Custom Text
Defines the formatting for information labels when enabled. Primary color used for up swing labels, secondary color used for down swing labels.
Stores values indentifying the type of swing for each zig zag swing.
Lower High (LH) = 1
Higher High (HH) = 2
Higher Low (HL) = 3
Lower Low (LL) = 4
Reset (no label) = 10
First Swing is Swing Low (no label) = 11
First Swing is Swing High (no label) = 12
Labels – Divergence (SG7)
Default: Custom Text
Defines the formatting for information labels when enabled and divergence is present. Primary color used for up swing labels, secondary color used for down swing labels.
Stores values according to direction of divergence.
0 = No Divergence
1 = Bullish Divergence (price moving lower with positive delta).
-1 = Bearish Divergence (price moving higher with negative delta).
Extension Line Properties (SG8)
Default: Line
Defines the swing high / low extension line properties, primary color is used for up swings and secondary color is used for down swings.
Zig Zag Mid-Point (SG9)
Default: Ignore (not shown unless ‘Enable Additional Subgraphs’ is set to yes).
Stores the mid-point price for each zig zag swing.
Reversal Price (SG10)
Default: Ignore (not shown unless ‘Enable Additional Subgraphs’ is set to yes).
Stores the reversal price for each zig zag swing.
Length (SG11)
Default: Ignore (not shown unless ‘Enable Additional Subgraphs’ is set to yes).
Stores the difference between the swing high and low for each zig zag swing.
Number of Bars (SG12)
Default: Ignore (not shown unless ‘Enable Additional Subgraphs’ is set to yes).
Stores the number of bars in each zig zag swing.
Zig Zag Oscillator (SG13)
Default: Ignore (not shown unless ‘Enable Additional Subgraphs’ is set to yes).
Stores the distance between the closing price of each chart bar and the prior swing high / low.