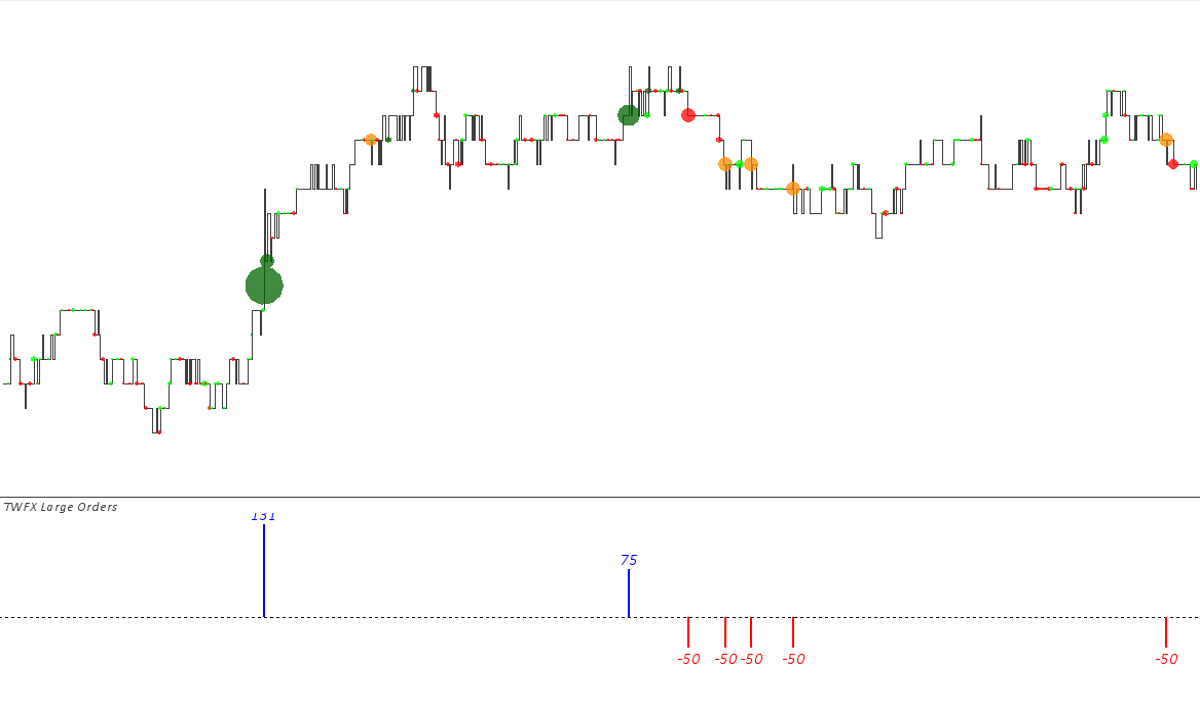
The Large Orders Study is designed specifically to be used with the Trade Tape Chart (Main) Study, the study provides an alternative means for displaying a histogram view of large orders, as defined by the filtering mode and the Trade Tape Chart combining mode.
Note: The Large Orders Study should not be considered to be 100% accurate in determining large orders that trade across multiple price orders, as they can only be inferred from market order behavior. A filter is included so that the method for displaying large orders can be adjusted depending on requirements.
The study is summarised in the following update post – Reconstructed Tape Chart.
Note:
- This study can only be used on charts with a chart data type of ‘Intraday Chart‘
- It is required to use ‘Intraday Data Storage Time Unit‘ setting ‘1 Tick’
- The study is designed specifically to be used in conjunction with the TWFX Trade Tape Chart study, it will not work in any other configuration.
Inputs
Minimum Volume Threshold – Graph (In:1)
Defines the minimum trade volume required before a volume historgram bar is displayed.
- Min: 0
- Max: 1000000
Ask Order Graph Color (In:2)
Defines the color used to draw histogram bars for Ask (Buy) orders.
Bid Order Graph Color (In:3)
Defines the color used to draw histogram bars for Bid (Sell) orders.
Minimum Volume Threshold – Text (In:4)
Defines the minimum trade volume required before a numeric volume label is displayed.
- Min: 0
- Max: 1000000
Ask Order Text Color (In:5)
Defines the color used to draw numeric labels for Ask (Buy) orders.
Bid Order Text Color (In:6)
Defines the color used to draw numeric labels for Bid (Sell) Orders.
Show Bid Order as Negative (In:7)
When this setting is enabled, ask orders and bid orders are displayed as positive and negative numbers respectively, centered about the x axis (zero).
Filtering Mode (In:8)
- None:
The total volume for any chart bar having met the either of the minimum volume thresholds is counted as large order volume. - Show Only Large Market Orders:
Where it is possible to determine, based on the Trade Tape Chart study configuration, large single trades having met either of the minimum volume thresholds will be counted as large orders. Where it is not possible to determine large orders across multiple price levels, the only the price level with the largest volume for a single trade will be counted as large order volume.
NOTE: For “Show Only Large Market Orders” to function correctly, the use of a Sierra Chart provided data feed is required and the “Combine Trades into Original Summary Trade” option must be enabled, refer to the following for more information – https://www.sierrachart.com/index.php?page=doc/ChartSettings.html#CombineTradesIntoOriginalSummaryTrade.
Days to Calculate (0 = All) (In:9)
Defines the number of days over which the study is calculated, can be used to reduce the initial study calculation time when many days worth of data is loaded into the chart but this study is only required to be shown on the most recent days.
- Min: 0 (in which case all loaded bars are evaluated during the study calculation)
- Max: 1000000
Alert Trigger Volume (In:10)
Defines the minimum size large order required to trigger the selected alert
- Min: 1
- Max: 1000000
Alert Sound (In:11)
Defines the alert sound / action triggered when ‘Alert Trigger Volume’ is met or exceeded.

Subgraphs
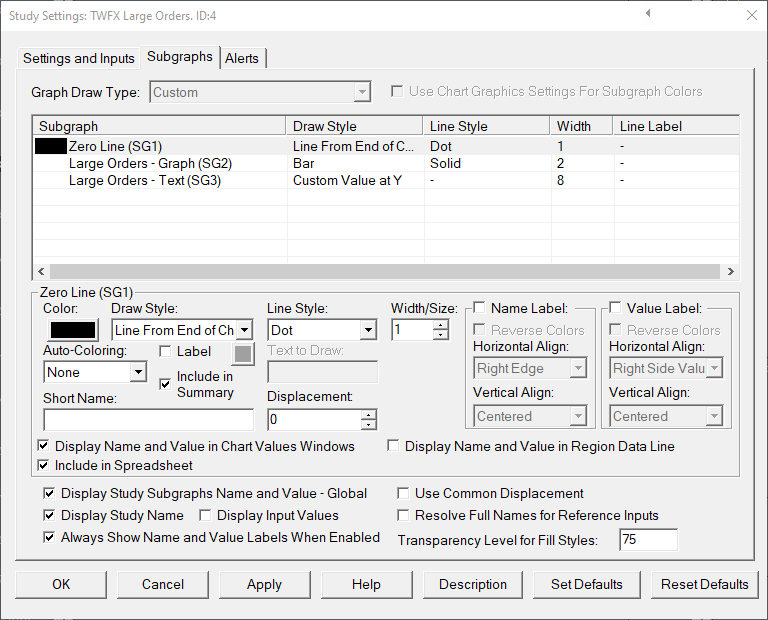
Zero Line (SG1)
Default: Line From End of Chart Left to Right
Displays horizontal axis at zero to suit zero centered subgraph display.
Volume – Graph (SG2)
Default: Bar
Plots the volume histogram, automatically reverts to default drawstyle if a text drawstyle is selected.
Volume – Text (SG3)
Default: Custom Value at Y
Display the numeric volume labels, automatically reverts to default drawstyle if a graphical drawstyle is selected.