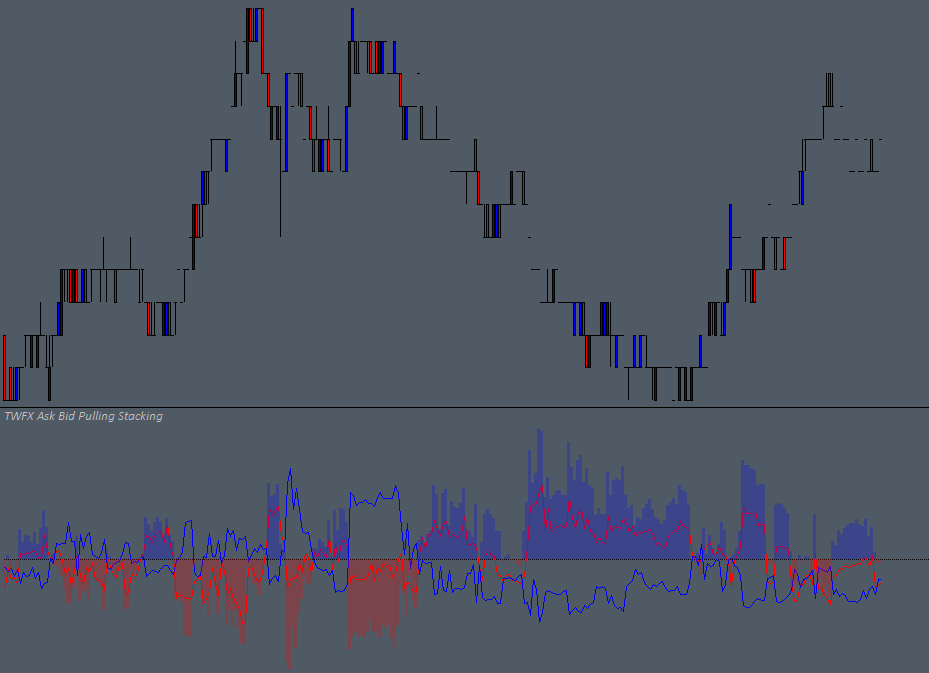
The Ask Bid Pulling Stacking study monitors the market liquidity / available orders over up to 100 Ask and Bid price levels in the DOM. The recorded values are displayed using upto 3 subgraphs, depending on the configuration of the study.
The study is summarised in the following update post – Ask Bid Pulling & Stacking.
Note:
- For this study to function, a trading DOM with a symbol corresponding to the main price graph must be open and have the Bid/Ask Market Depth Pulling/Stacking column added, as described in the Sierra Chart documentation – Customize Chart/Trade DOM Columns.
- Data is recorded by the study each time the chart is updated (according to the Chart Update Interval) and remains persistent in the memory until the the chart symbol is changed, or the application (or chart) is closed, the data is not permanently saved. In addition, the chart update interval should be set to a value lower than the Bar Duration.
- This study can only be used on charts with a chart data type of ‘Intraday Chart‘
- It is recommended to use ‘Intraday Data Storage Time Unit‘ setting ‘1 Tick’
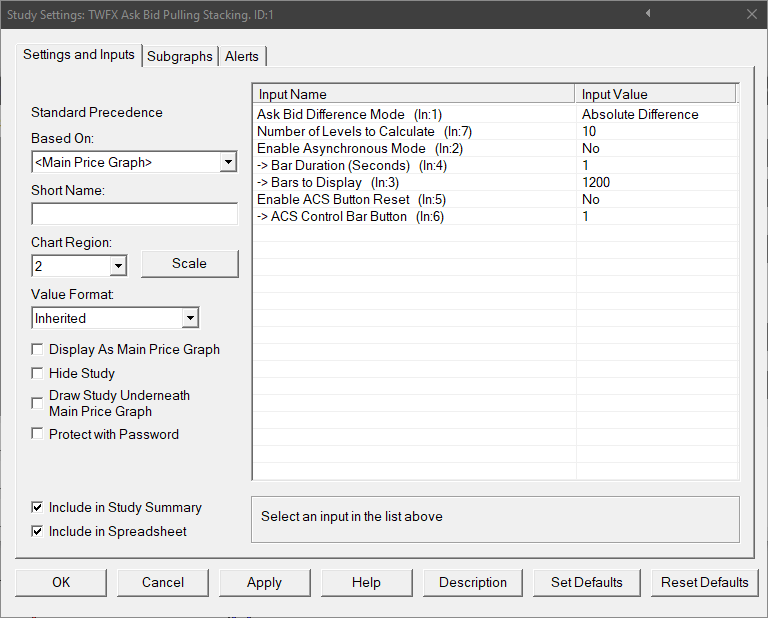
Inputs
Select how the difference between the Ask Pulling & Stacking sum and the Bid Pulling & Stacking sum is calculated / displayed:
- Ask – Bid
- Bid – Ask
- Absolute Difference (i.e. only magnitude, sign is ignored)
- Bull/Bear Difference ([Stacked Bid + Pulled Ask] – [Stacked Ask + Pulled Bid], also affects the sum subgraphs SG2 and SG3)
Number of Levels to Calculate (In:7)
Select how many price levels to include in the pulling & stacking sums
- Min: 1
- Max: 100
Select the time period for the study subgraph display, applies to Asynchronous mode only:
- Min: 1 Second
- Max: 15 seconds
Select how many bars to display in the subgraph output, applies to Asynchronous mode only:
- Min: 60
- Max: 1800
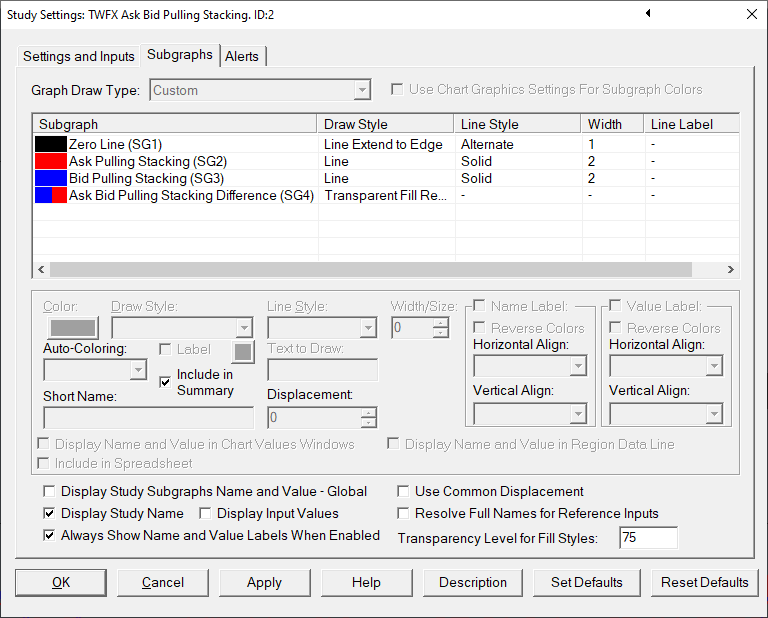
Subgraphs
Displays horizontal axis at zero to suit zero centered subgraph display
Default: Line
Displays the sum of the Ask Pulling and Stacking values (in Bull/Bear mode displays Bid Stacked + Ask Pulled)
Default: Line
Displays the sum of the Bid Pulling and Stacking values (in Bull/Bear mode displays Stacked Ask + Pulled Bid)
Default: Line
Displays Ask Bid Difference as defined by the ‘Ask Bid Difference Mode’ input.