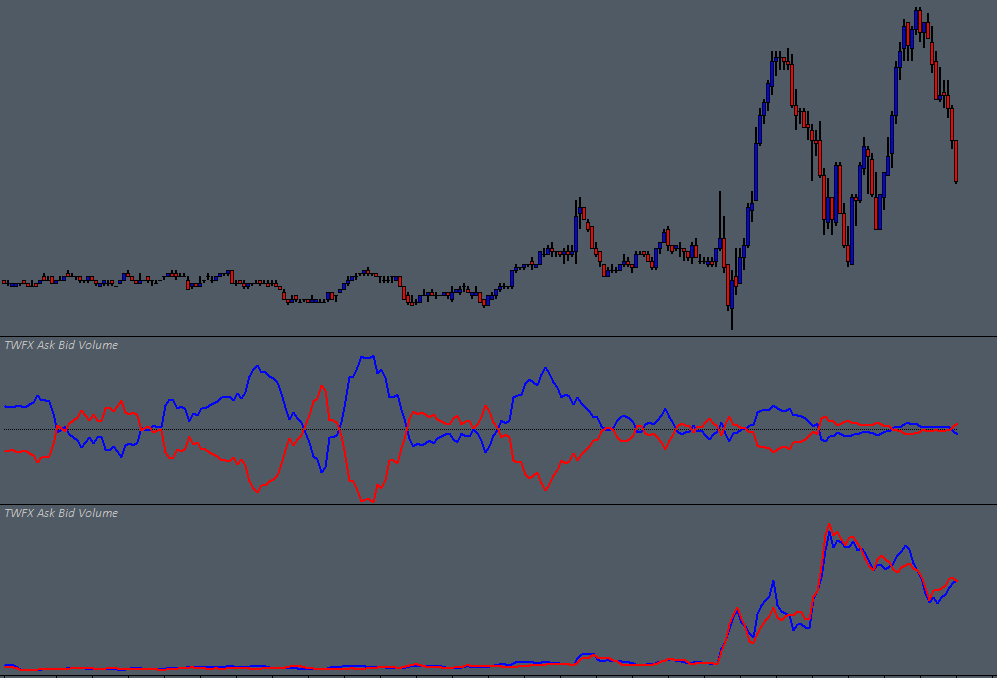
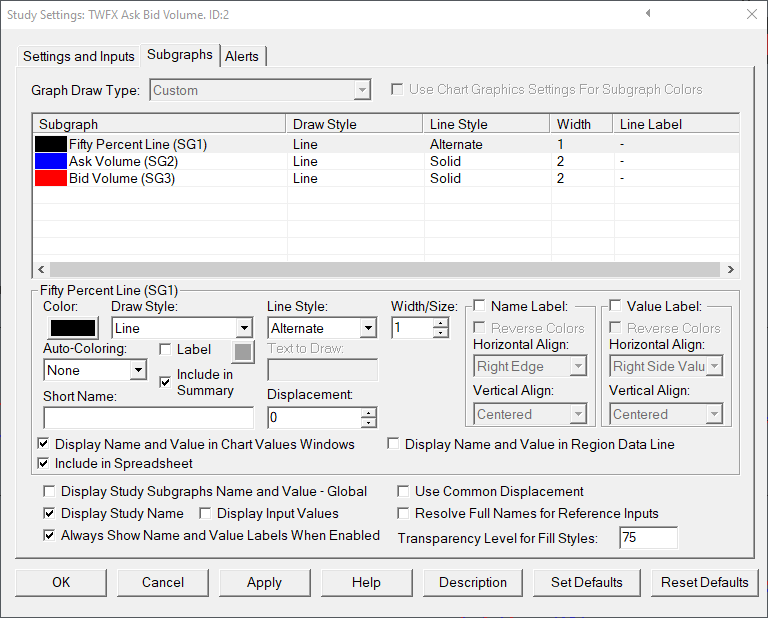
The Ask Bid Volume study tracks the total Ask and Bid volume traded per chart bar period, the recorded values are displayed using 2 subgraphs.
The study is summarised in the following update post – Ask Bid Volume.
Note:
- This study can only be used on charts with a chart data type of ‘Intraday Chart‘
- It is recommended to use ‘Intraday Data Storage Time Unit‘ setting ‘1 Tick’
Inputs
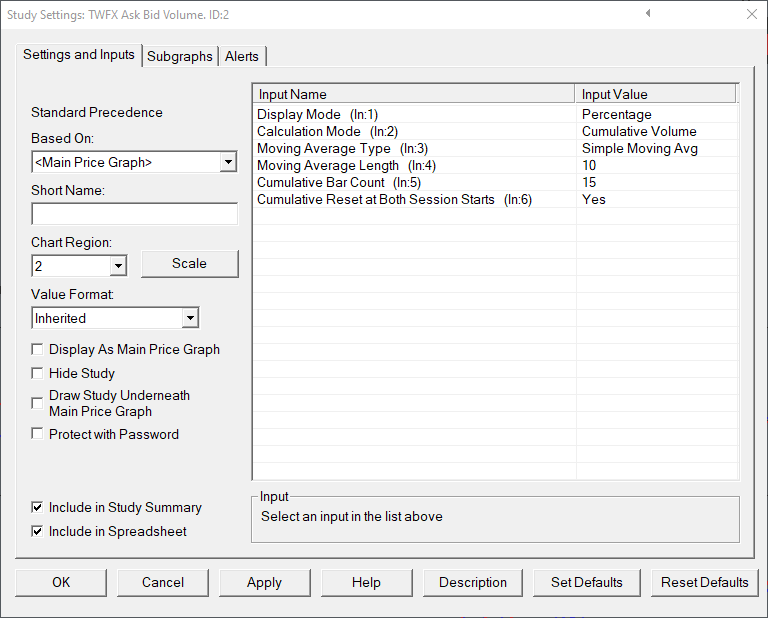
- Actual: The output is based on the actual traded Ask and Bid volume per chart bar period.
- Percentage: The output is based on the Ask and Bid volume as a percentage of the total traded volume per chart bar period.
- Raw Data: Display the selected data (actual or percentage) in an unaltered format.
- Volume Moving Average: Apply the specified moving average parameters to the selected data (actual or percentage) before displaying.
- Cumulative Volume: Apply a rolling cumulative sum, of the length specified, to the selected data (actual or percentage) before displaying. Rolling cumulative sum is applied before percentage calculation.
Select the moving average type that is applied to the volume data, applies to ‘Volume Moving Average’ calculation mode only. Details of the moving average types can be found in the documentation on the Sierra Chart website – Moving Average Type.
Define the moving average length, applies to ‘Volume Moving Average’ calculation mode only.
- Min: 3
- Max: 100000
Define the count of bars to be used for the cumulative rolling sum calculation.
- Min: 3
- Max: 100000
Cumulative Reset at Both Session Starts (In:6)
When this setting is enabled, the cumulative volume sum will be reset at the beginning of both trading session, otherwise it will be reset only at the beginning of the trading day.


