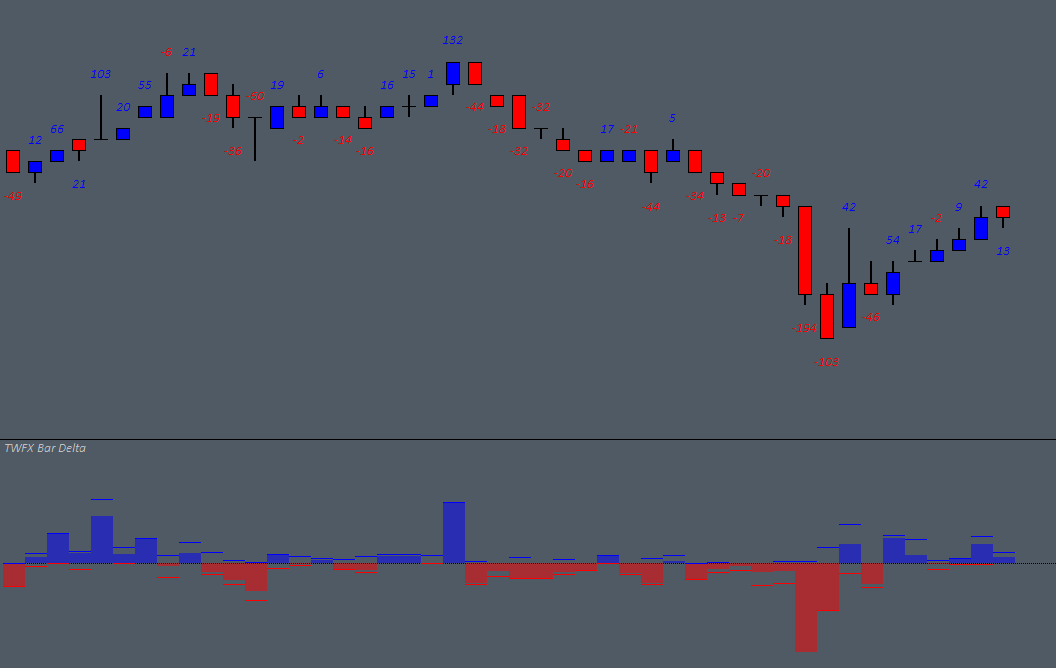
The Bar Delta study tracks the difference (Delta) between Ask and Bid traded volume per chart bar period, the recorded values can be displayed in various configurations, using multiple subgraphs. Choose from graphical or text display options, and optionally show the minimum and maximum delta per chart bar period. The study also provides a simple visual alert feature to highlight when the bar delta meets or exceeds specified parameters.
The study is summarised in the following update post – Bar Delta.
Note:
- This study can only be used on charts with a chart data type of ‘Intraday Chart‘
- It is recommended to use ‘Intraday Data Storage Time Unit‘ setting ‘1 Tick’
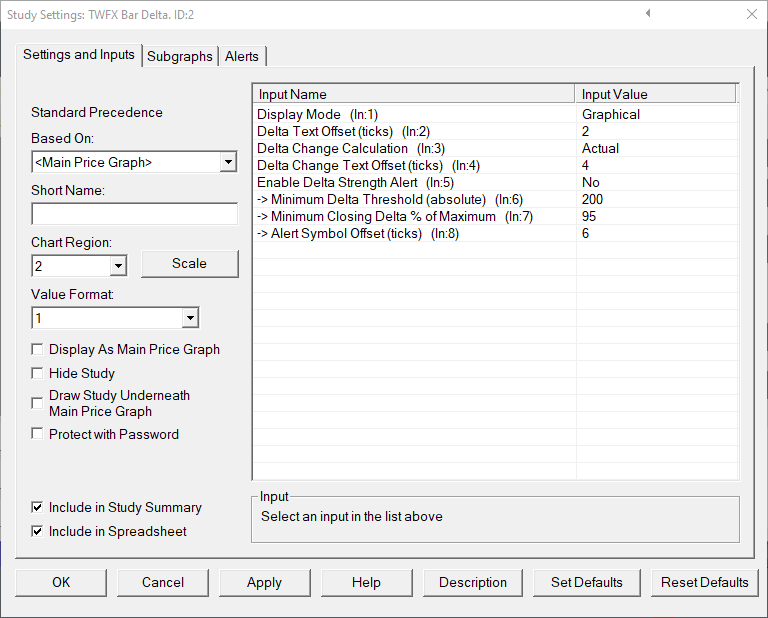
Inputs
- Graphical: The data is displayed graphically in a separate chart region to the main price graph.
- Value on High: The data is displayed as text, above the high of the chart bar, offset by the specified amount.
- Value on Low: The data is displayed as text, below the low of the chart bar, offset by the specified amount.
- Value on High/Low: The data is displayed as text, offset by the specified amount, either above the high of chart bars where Close >= Open, or below the low of chart bars where Close < Open.
Specify the delta text display position, offset from high/low measured in ticks.
- Min: 0
- Max: 50
- Actual: Displays the actual change in delta bewteen the current and prior chart bar.
- Percentage: Display the change in delta between the current and prior chart bar, calculated as a percentage of the prior chart bar.
Specify the delta change text display position, offset from high/low measured in ticks.
- Min: 0
- Max: 50
When this option is enabled, a visual alert is provided when the bar delta meets the specified ‘Minimum Delta Threshold‘ and ‘Minimum Closing Delta % of Maximum‘ conditions.
Specify the minimum absolute value for Delta required for alert to be triggered.
- Min: 0
- Max: 1000000
Specify the minimum closing delta value as a percentage of the maximum delta for the chart bar.
- Min: 75%
- Max: 100%
Specify the alert symbol display position, offset from the high/low measured in ticks. Positve delta alerts are displayed above the high and negative delta alerts are displayed below the low.
- Min: 0
- Max: 20
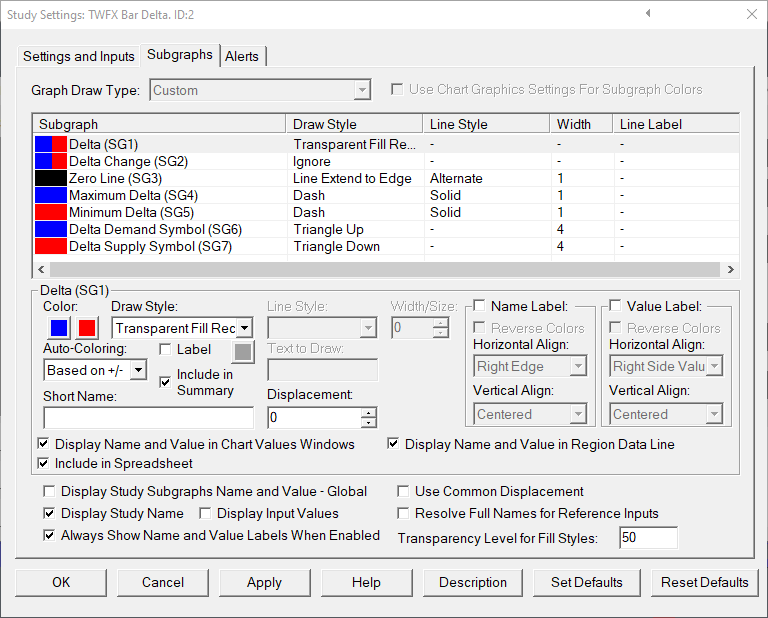
Subgraphs
Default Graphical: Fill Rectangle to Zero
Default Text: Custom Value at Y
Displays Delta, the difference between the Ask and Bid traded volume.
Default: Ignore
Displays the result of the Delta Change calculation
Default: Line Extend to Edge
Displays horizontal axis at zero to suit zero centered subgraph display
Default: Ignore
Displays the Maximum Delta that occurred within the chart bar period
Default: Ignore
Displays the Minimum Delta that occurred within the chart bar period
Default: Triangle Up
Displays a visual alert when the Delta Strength Alert is triggered by a positive Delta
Default: Triangle Down
Displays a visual alert when the Delta Strength Alert is triggered by a negative Delta