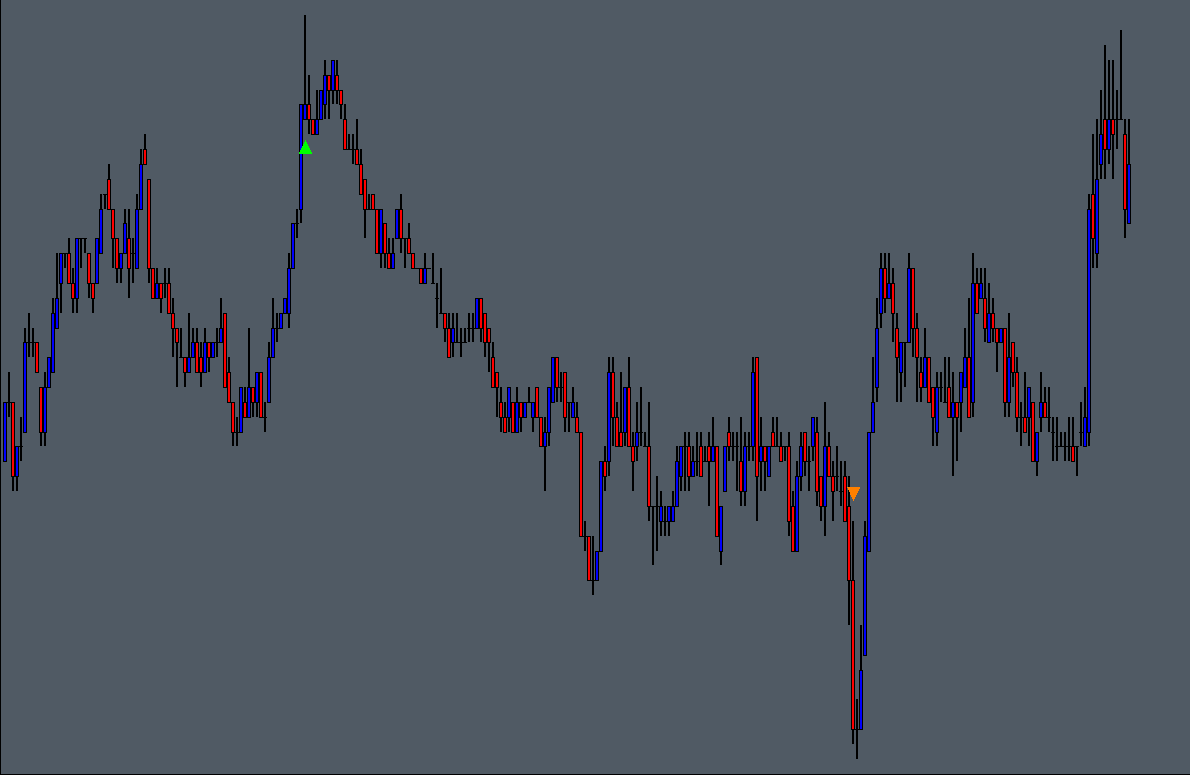
The Bar Delta Imbalance study monitors the Ask and Bid traded volume per chart bar period and provides a visible alert when specified input conditions are met, a separate subgraph is used for the positive (demand imbalance) and negative (supply imbalance) conditions.
The study is summarised in the following update post – Bar Delta Imbalance.
Note:
- This study can only be used on charts with a chart data type of ‘Intraday Chart‘
- It is recommended to use ‘Intraday Data Storage Time Unit‘ setting ‘1 Tick’
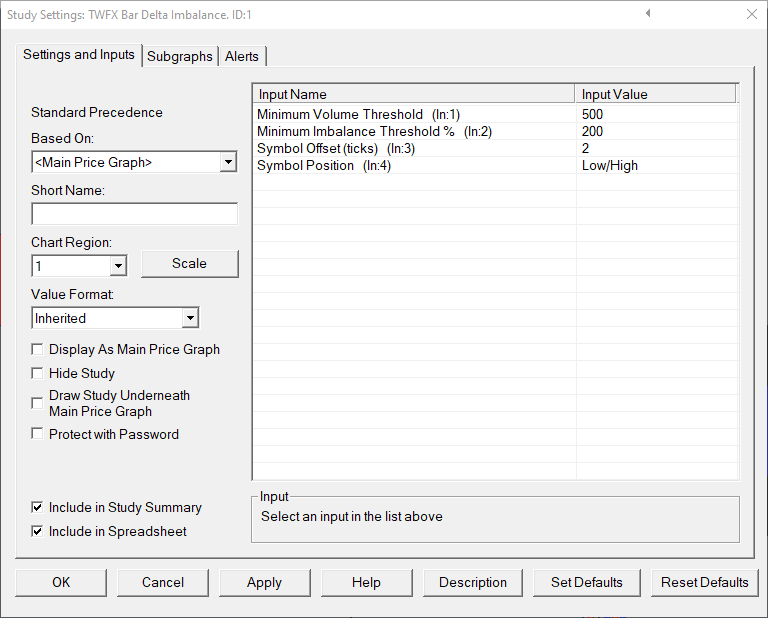
Inputs
Specify the minium total traded volume required before the chart bar is evaluated for delta imbalance conditions.
- Min: 0
- Max: 1000000
Specify the minimum Delta imbalance percentage required for an alert to be triggered. Imbalance percentage is defined as dominant side traded volume as a percentge of non-dominant side traded volume.
- Min: 101%
- Max: 1000%
Specify the delta alert symbol display position, offset from high/low measured in ticks.
- Min: 0
- Max: 50
Specify the position for the delta imbalance alert symbol.
- Low: The symbol is displayed below the low of the chart bar, offset by the specified amount.
- High: The symbol is displayed above the high of the chart bar, offset by the specified amount.
- High/Low: Delta demand symbols are displayed below the low of the chart bar, offset by the specified amount. Delta supply symbols are displayed above the high of the chart bar, offset by the specified amount.
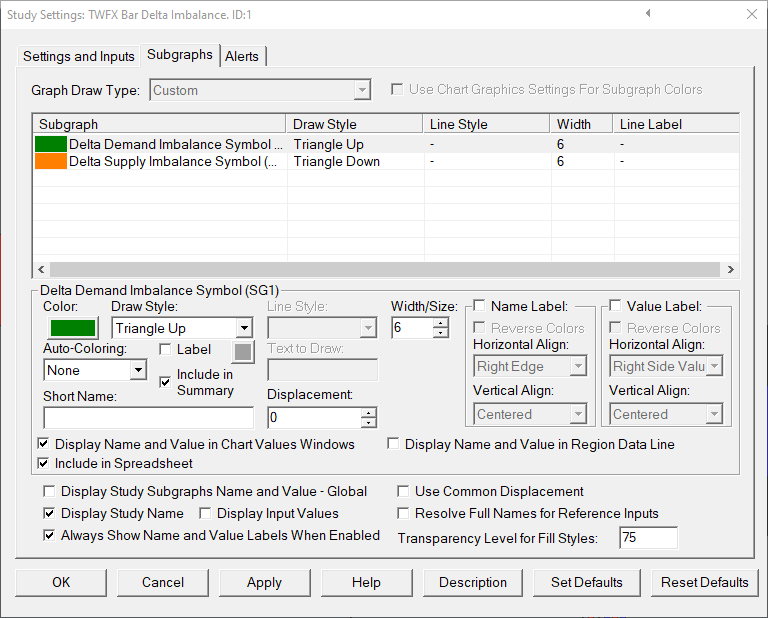
Subgraphs
Default: Triangle Up
Displays a visual alert when the Delta Imbalance Alert is triggered by a positive Delta
Default: Triangle Down
Displays a visual alert when the Delta Imbalance Alert is triggered by a negative Delta