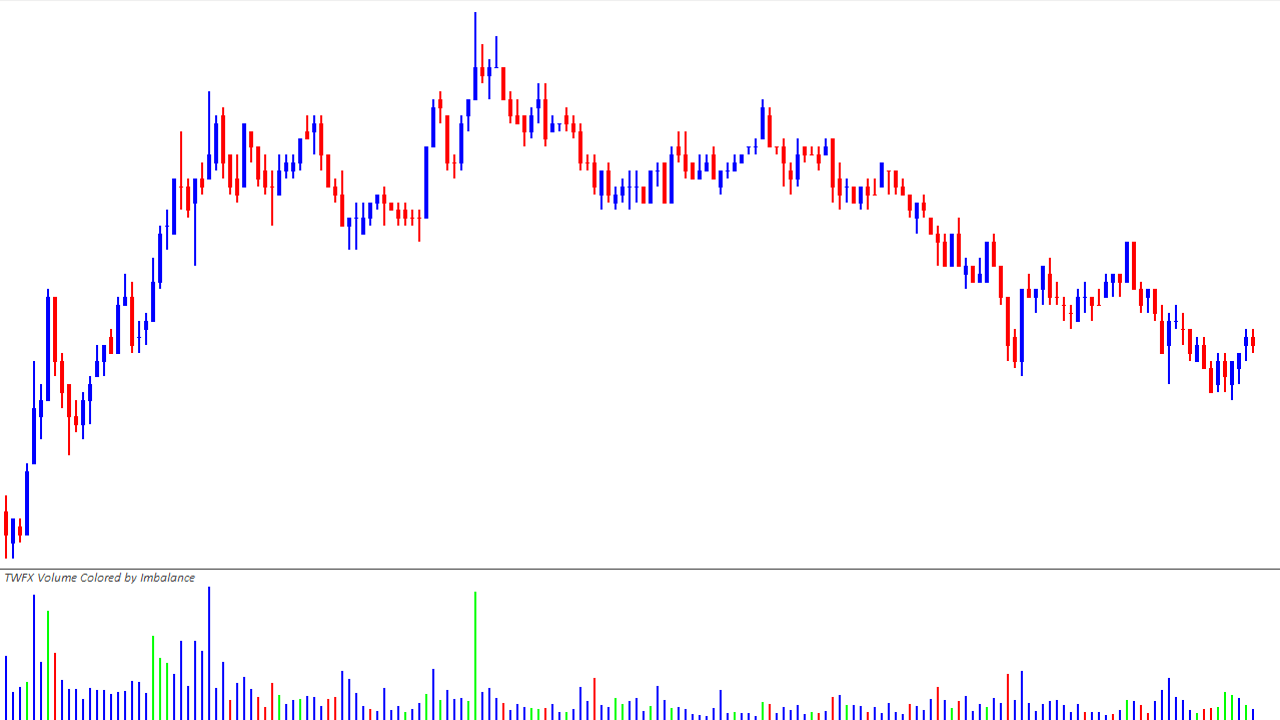
The Volume Colored by Imbalance Study displays traded volume as a histogram, showing total volume per chart bar.
Histogram bars are colored either as ask dominant, bid dominant or neutral, based on either a simple comparison of ask vs. bid volume, or comparsion to a configurable dominance threshold.
The study is summarised in the following update post – Volume Colored by Imbalance.
Note:
- This study can only be used on charts with a chart data type of ‘Intraday Chart‘
- It is recommended to use ‘Intraday Data Storage Time Unit‘ setting ‘1 Tick’
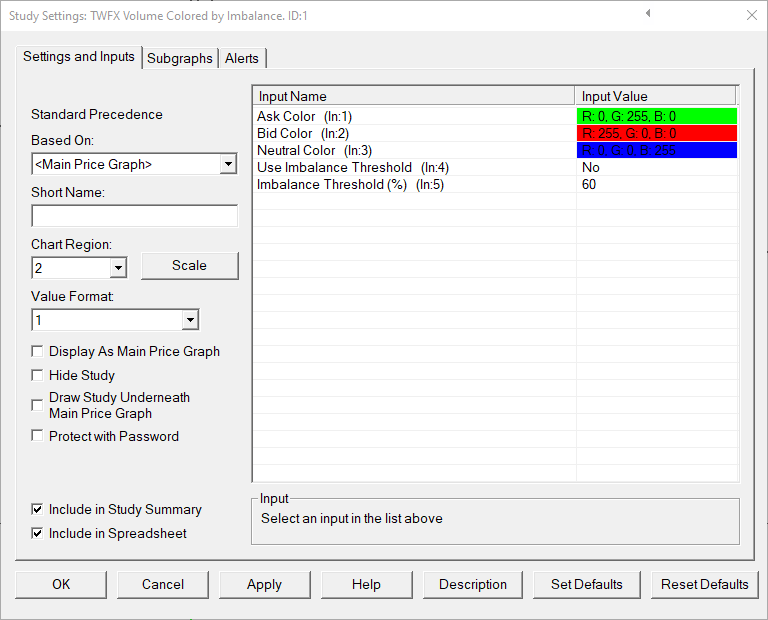
Inputs
Ask Color (In:1)
Defines the color used when either Ask volume > Bid volume, or, when ‘Use Imbalance Threshold’ is enabled, the Ask volume / Total Volume > Imbalance threshold.
Bid Color (In:2)
Defines the color used when either Bid volume > Ask volume, or, when ‘Use Imbalance Threshold’ is enabled, Bid volume / Total Volume > Imbalance threshold.
Neutral Color (In:3)
Defines the color used when neither Ask or Bid is determined to be dominant.
Use Imbalance Threshold (In:4)
When enabled, the imbalance threshold is used to determine whether Ask or Bid is dominant.
Imbalance Threshold (%) (In:3)
Defines the minimum Ask / Bid volume imbalance required for one side to be considered dominant.
- Min: 1
- Max: 1000
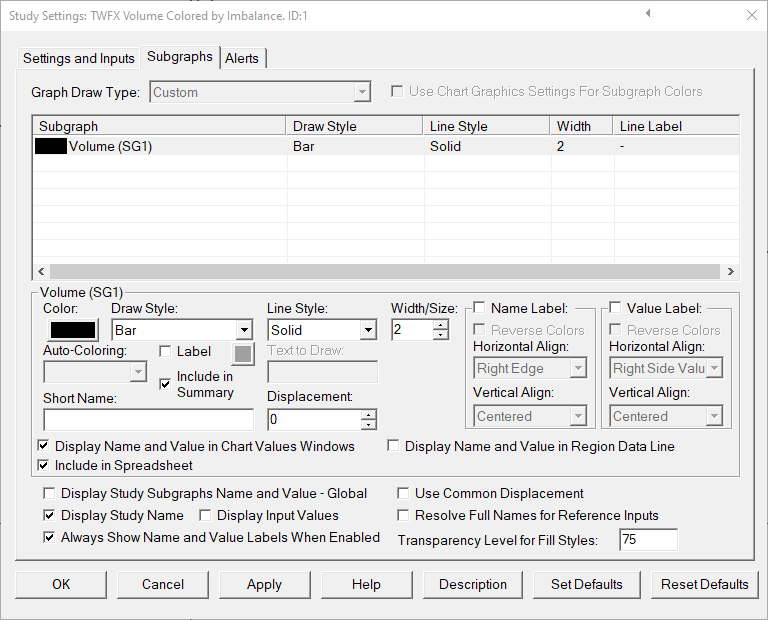
Subgraphs
Volume (SG1)
Default: Bar
Displays the total traded volume per chart bar