TWFX Volume Dots

What's Included?
The TWFX Volume Dots Study contains the following related studies –
- TWFX Volume Dots
- TWFX Delta Dots
- TWFX Volume Dots – LW
- TWFX Delta Dots – LW
More information can be found either in the relevant blog update posts Volume Dots / Delta Dots, or in the study documentation Volume Dots Study / Delta Dots Study.
LW suffixed studies use only native Sierra Chart drawing output styles and are subject to a number of limitations when compared to the non-LW studies. LW studies are included specifically for compatibility with OpenGL graphics.
TWFX Volume Dots and TWFX Delta Dots are both configured for high performance chart drawing, they offer a significant performance improvement* vs. the LW suffixed versions (when not using OpenGL graphics).
*Reductions in chart drawing times of greater than 80% were observed during testing, actual improvements may vary depending on computer software / hardware configuration.
Features
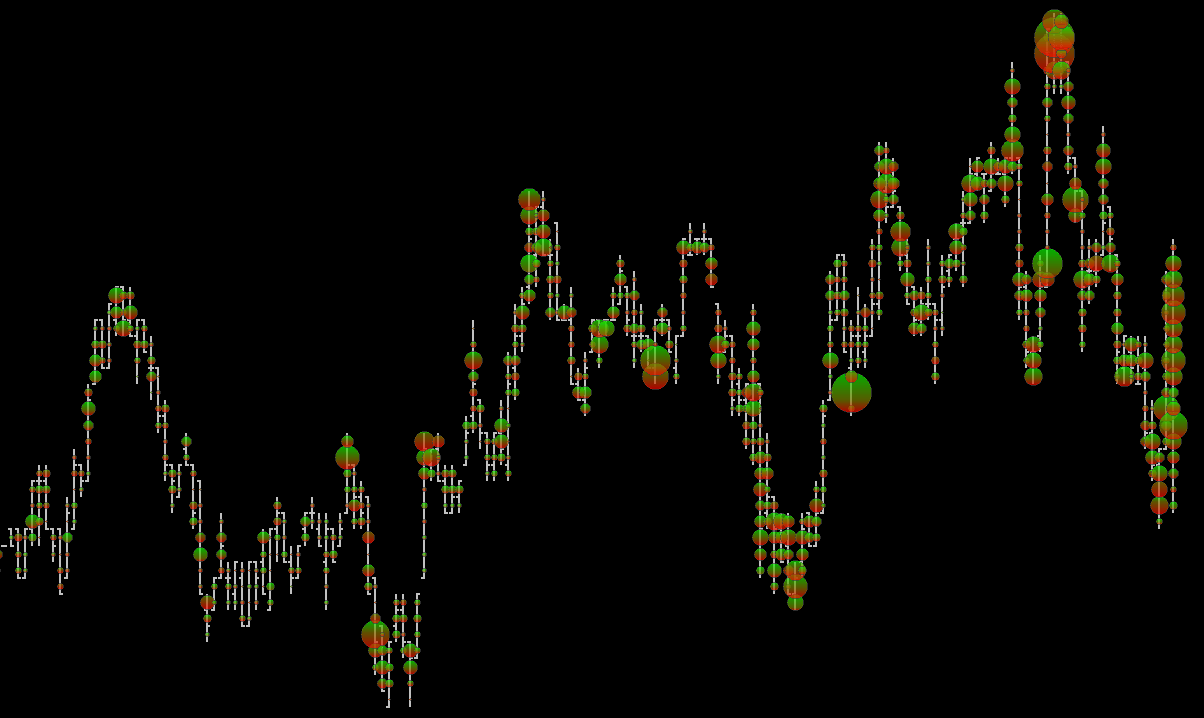
Display a visual representation of volume at price and time, apply narrow filters to focus on key activity areas or plot without filtering to provide a broad view of volume distribution.
- Identify and highlight volume levels based on filtering criteria
- Calculate per price level for each chart bar period or total per bar period
- Volume and Delta filtering options:
- Total Volume
- Delta Imbalance
- Delta Difference
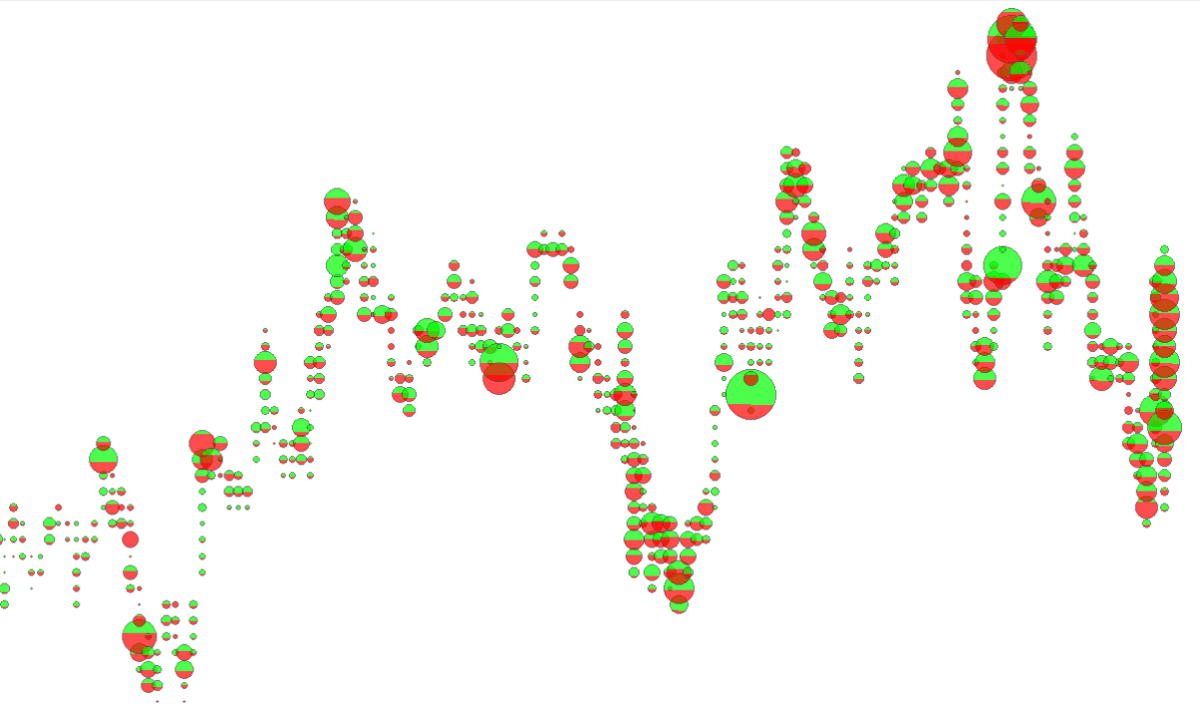
- Fixed or Automatic Variable size Dot Plot
- Configurable Minimum and Maximum Dot Sizes
- Variable sizing based on trading session, visible range or all data
- Optional Dynamic Scaling vs. chart zoom level (LW)
- Optional variable color intensity
- Separate color ranges for Total, Ask Dominant and Bid Dominant Volume
- Transparency option
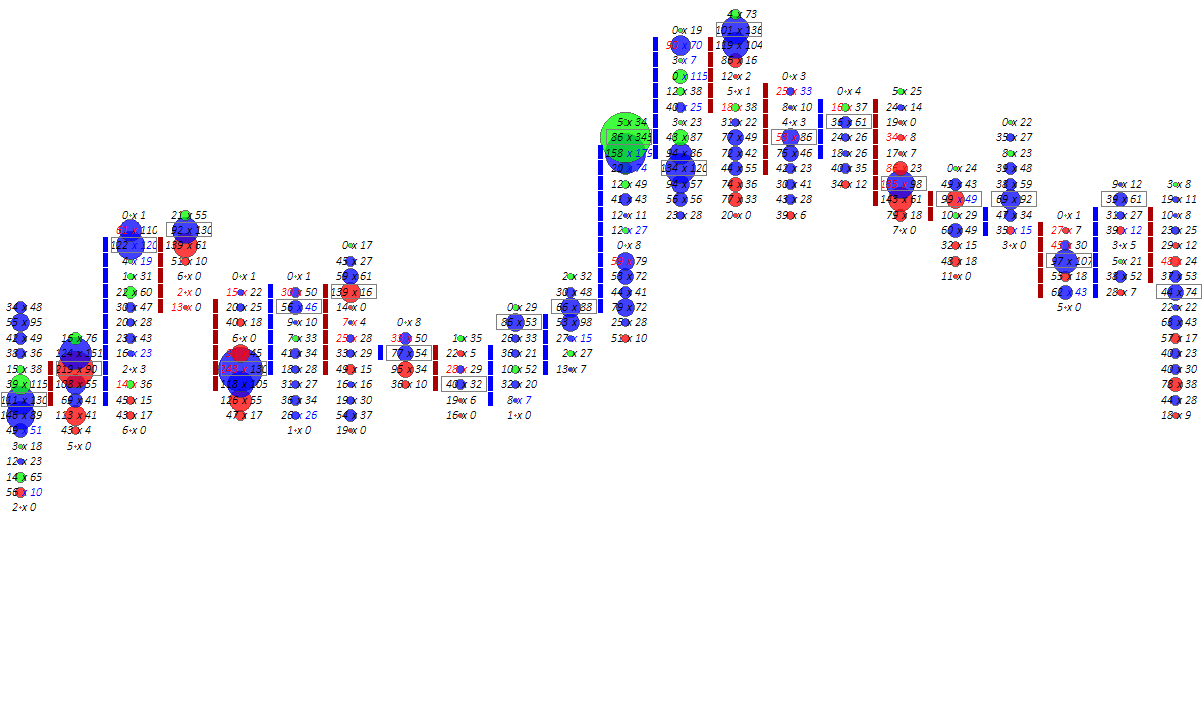
- Display / Coloring modes include:
- Total Volume
- Dominant Side
- Ask/Bid Pie (LW)
- Ask/Bid Split / Segment (LW)
- Ask/Bid Color Gradient (LW)
- Plots upto 256 dots per chart bar period (LW studies limited to 56)
- Optimized for high performance calculation and chart drawing (LW)
Note: LW means feature not included in LW studies
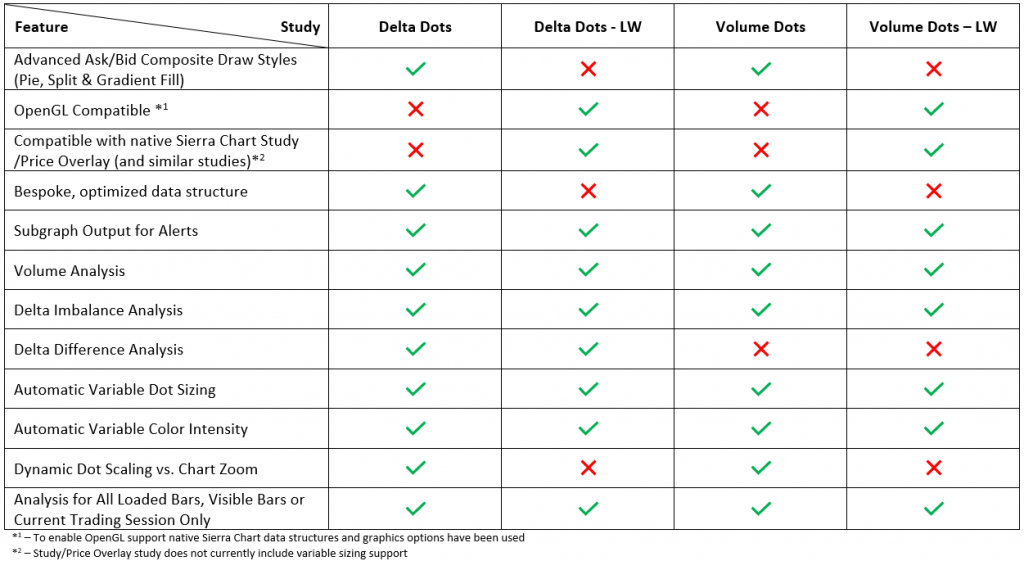
Feature Comparison
Software Requirements
To use the TWFX Volume Dots Studies, you will need a Sierra Chart Service Package 3 or Package 5 subscription.
Use of a good quality data feed, providing accurate tick-by-tick data is a requirement, anything less may provide inaccurate representations of volume
Release Notes
v1.0.0.0 – Initial Release – Requires Sierra Chart v2107 or later.
v1.0.0.1 – 26/08/2020 – TWFX_VDS_64.dll requires Sierra Chart v2138 – v2146, TWFX_VDS_2151_64.dll requires v2155 or later
v1.0.0.2 – 01/09/2020 – TWFX_VDS_64.dll requires Sierra Chart v2138 – v2146, TWFX_VDS_2151_64.dll requires v2155 or later
v1.0.0.3 – 15/09/2020 – TWFX_VDS_64.dll requires Sierra Chart v2138 – v2146, TWFX_VDS_2151_64.dll requires v2155 or later
v1.0.0.4 – 28/11/2020 – Requires Sierra Chart v2195 or later.
v1.0.0.5 – 03/04/2021 – Requires Sierra Chart v2195 or later.
v3.0.3.0 – 17/04/2026 – Requires Sierra Chart v2566+ or 2897+ (separate files are provided).
Getting Started
- After purchasing, you will receive a license key via email (which you can also find in the ‘My Account’ section here)
- Activate your license key and assign it to your Sierra Chart account here
- After your license is activated and assigned, the software will automatically download next time you restart Sierra Chart (or you can download the software here)
- Restart Sierra Chart and start using the studies
- More general information can be found in the FAQs section
- For information specific to these studies see Volume Dots Study and Delta Dots Study
Purchasing Options
Free Trial
15-Days Free- Limited to one per customer
- Fully Featured
- Try before you buy
- Technical support available
Monthly
Subscription- Recurring payment
- Cancel any time
- Receive product updates
- Technical support available
Annual
12 Month License- Recurring payment
- >15% Saving vs. Monthly
- Receive product updates
- Technical support available
Lifetime
No Expiry License- One time payment
- Best value option
- 12-months product updates
- 12-months technical support
2 reviews for TWFX Volume Dots
You must be logged in to post a review.
M Patel (verified owner) –
What can I say, added it to my numbers bar chart and immediately, saw the benefit 🙂
As the delta or volume starts to increase, the bubble starts to build so imemdiately you can see where absorbtion/interest etc is taking place.
The ability to show both bid/ask delta as well as volume as a pie/or as gradient/or as split relaly adds to the information (compared to just plotting the bubble with the dominant side – although this is available too)
As a long term user of Sierra Chart I know a good deal when I see it (espcially if you are interested in trading order flow).
Had a 15 day trial, after two days, purchased it outright.
Dgibson2550 –
Works beautifully!